Optimize:ai Scan Results
Optimize:ai is designed to refine the performance of Retrieval-Augmented Generation (RAG) pipelines by optimizing cost, latency, and carbon emissions while maintaining above-threshold functional performance. This document outlines the development and operational methodology of the Optimize AI solution.
The Aim of Optimize:ai
The primary goal of Optimize:ai is to enhance the efficiency of users' RAG pipelines across three critical aspects:
- Cost: Reducing operational expenses.
- Latency: Decreasing the time taken to retrieve and generate responses.
- Carbon Emissions: Minimizing the environmental impact of operations.
Functional performance is assessed through Safety and Alignment Scores, ensuring that the system not only operates efficiently but also safely and in alignment with ethical standards.
Solution Overview
Optimize:ai solution simulates various RAG configurations to identify the most effective setup for the user’s specific requirements. During this simulation, the system evaluates:
- SCI per call: Following the SCI Guidance, the system calculates the Sustainable Carbon Intensity for each API call.
- Cost: Estimating the expected operational costs.
- Safety and Alignment Metrics: Assessing the model's safety and alignment with ethical standards if these evaluations are enabled.
Methodology: Configuring the Best RAG Setup
The backend processes user requests by computing all possible iterations of the RAG pipeline, exploring unique combinations of configurations. These configurations adjust various operational parameters such as:
- Chunking Strategies: Size (256, 512, 1024) and number of retrieved chunks (2, 4, 8).
- Retrieval Strategies: Re-ranking of retrieved contexts and the use of different embedding models (bge-small and ada embedding model from OpenAI).
- Quantization Strategies: Model quantization and pruning methods.
- Energy Use Strategies: Optimal combination of providers and regions for reduced CO2 emissions. Calculation of carbon emissions based on the chosen provider, region, and processor type.
Carbon Emissions and SCI Calculations
Carbon emissions are estimated by:
- Determining the processor's thermal design power.
- Assessing the provider's carbon impact value.
- Using data from the MLCO2 database to ascertain the gCO2eq per kWh consumed.
- Get the Hours used from the average latency of the RAG iterations and calculate the total hours used estimate by using the average latency multiplied by the number of total queries in a project and number of users.
Carbon Emissions = Power Consumption of processor * Hours used * Impact of the provider and region
The SCI Score, calculated per API call, incorporates:
- Energy Consumption (E) of different components like CPU/GPUs, data storage, memory allocation, and network data transfer.
- Data used: baovizta API endpoints
- Emissions Factors (I), ideally marginal and granular, reflect regional or specific conditions.
- Data used: Carbon intensity of electricity generation
- Embodied Emissions (M) from hardware used.
Overview of Optimize Scan Results
The rest of this document provides a detailed guide on accessing and interpreting the results from Optimize scans, including visual representations and data analysis from the Trustwise Control Plane. This will include steps to access scan results, view previous scans, analyze leaderboard metrics, and generate detailed reports for further analysis. The Trustwise Control Plane allows users to monitor and analyze the performance of their language models effectively. This section will help you navigate through the results of the scans you have conducted.
Step 1: Access Scan Results
Start by navigating to the Trustwise Control Plane. This is where all your scan activities are centralized.
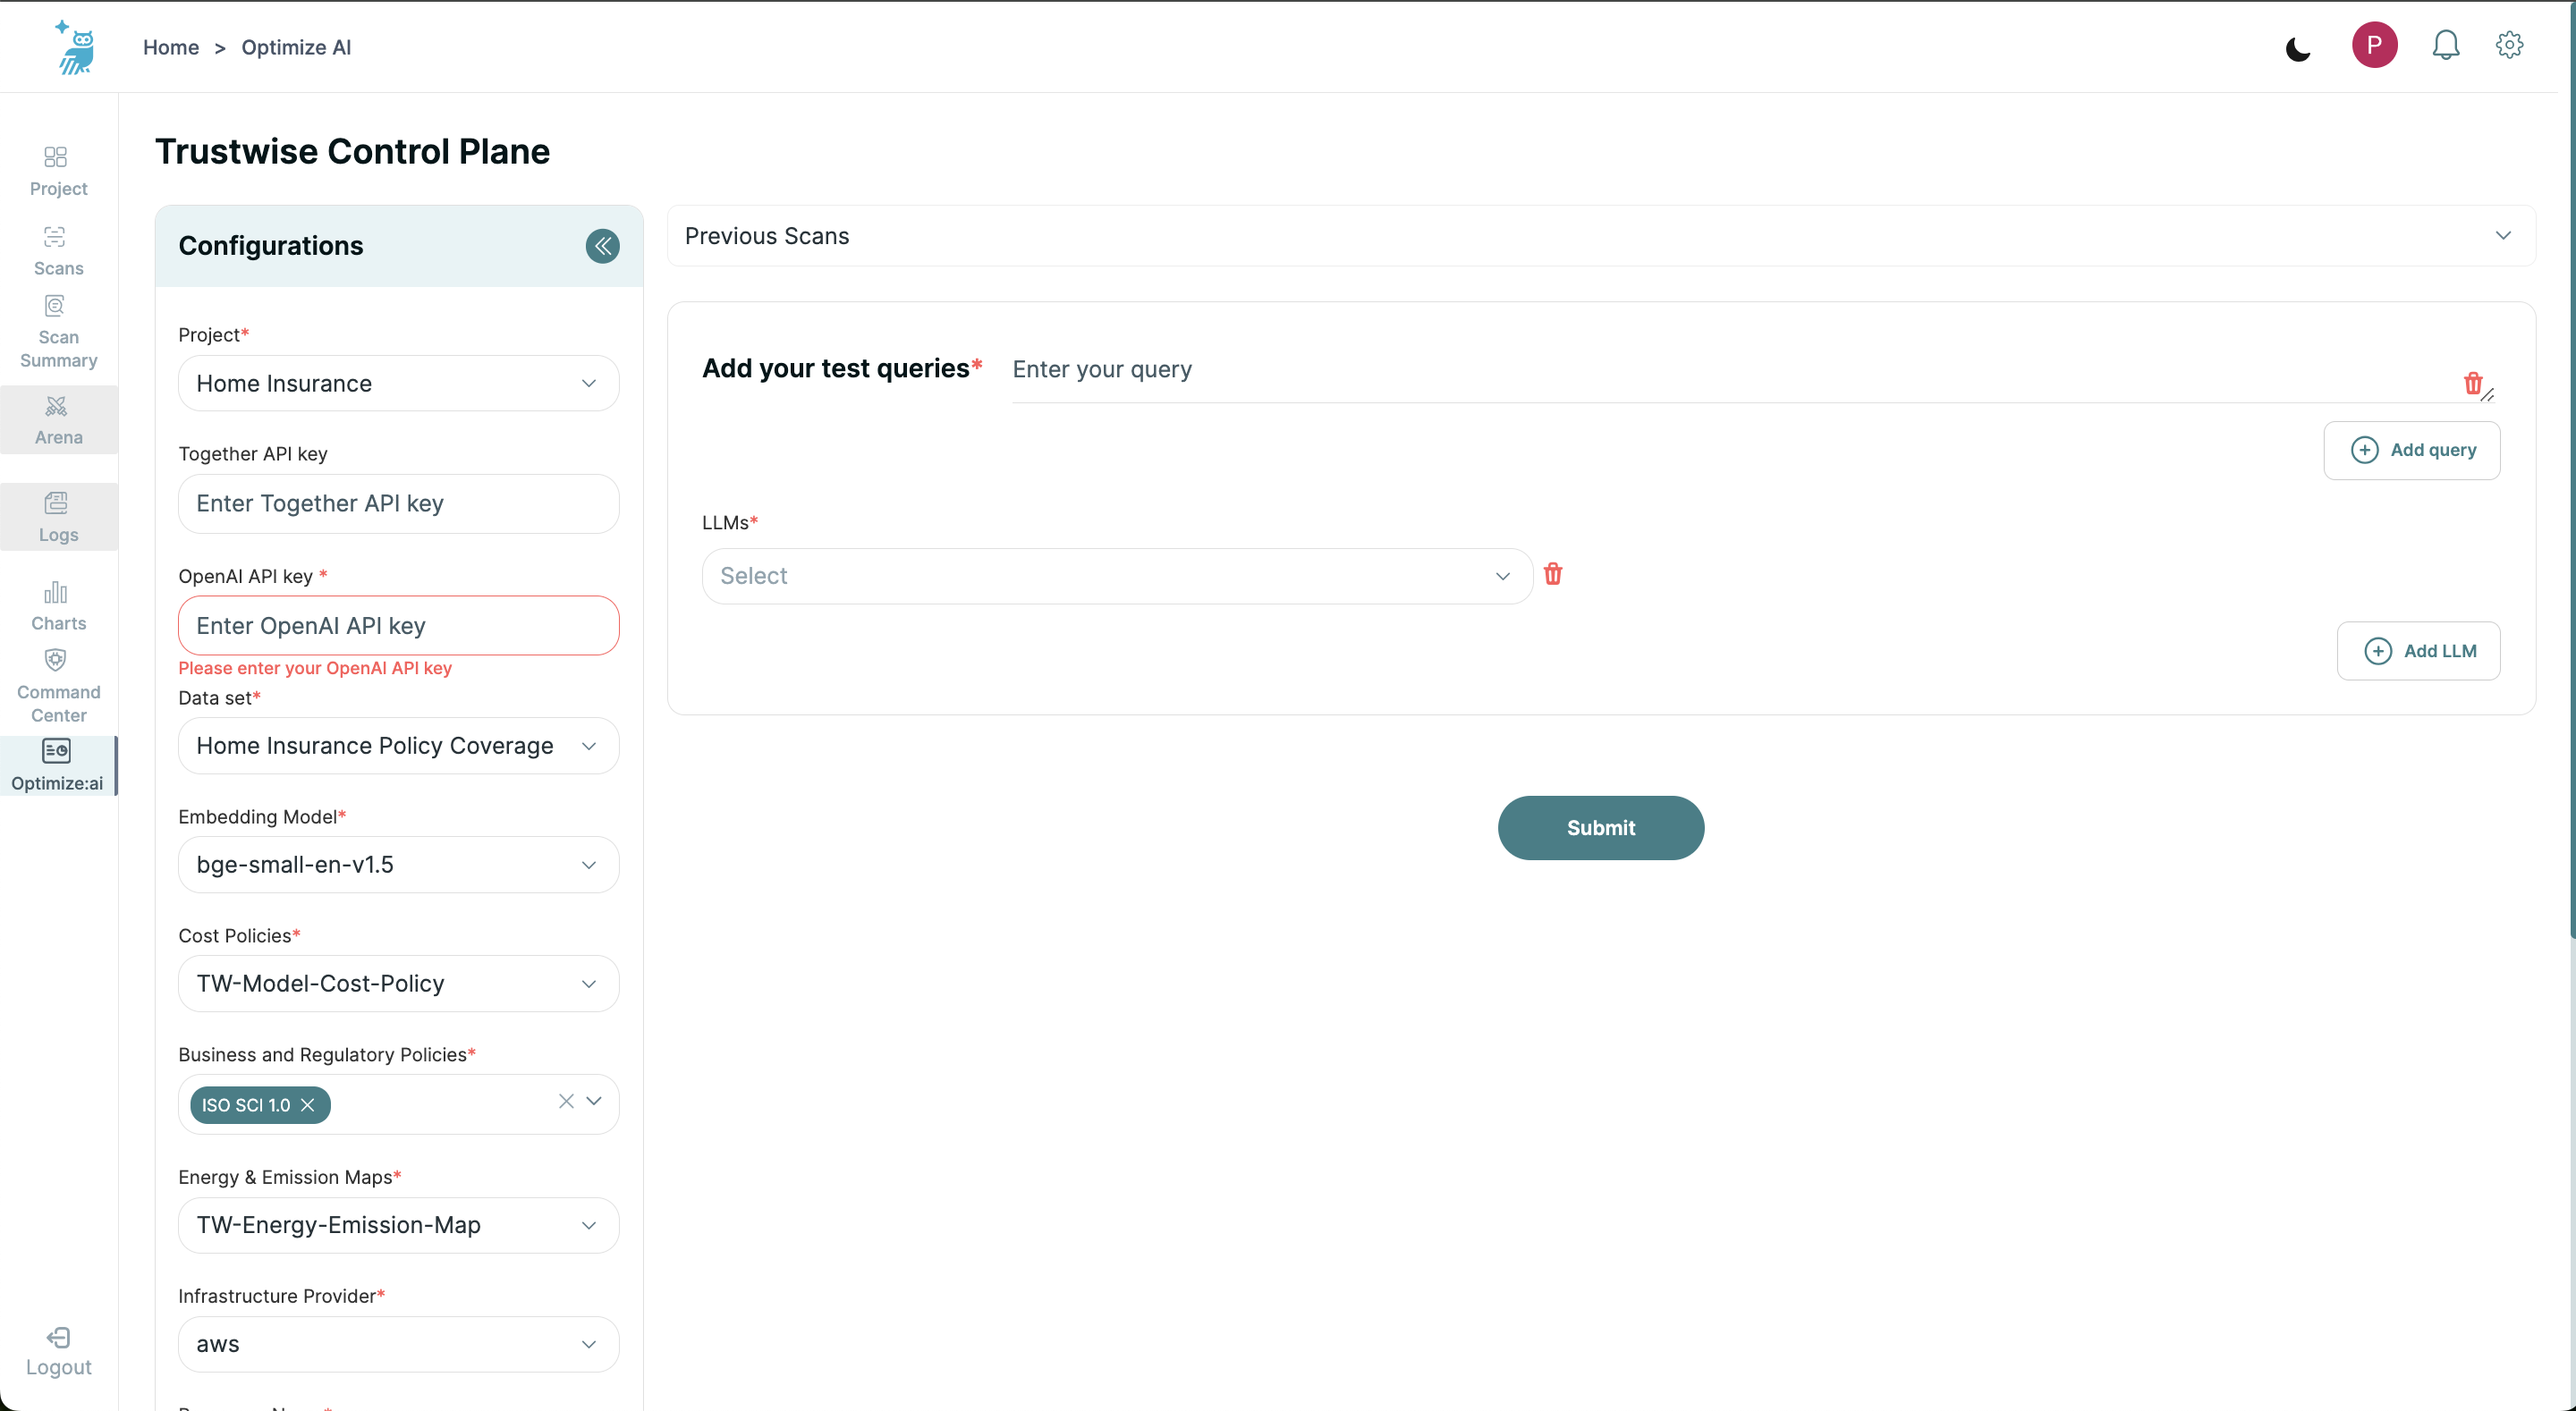
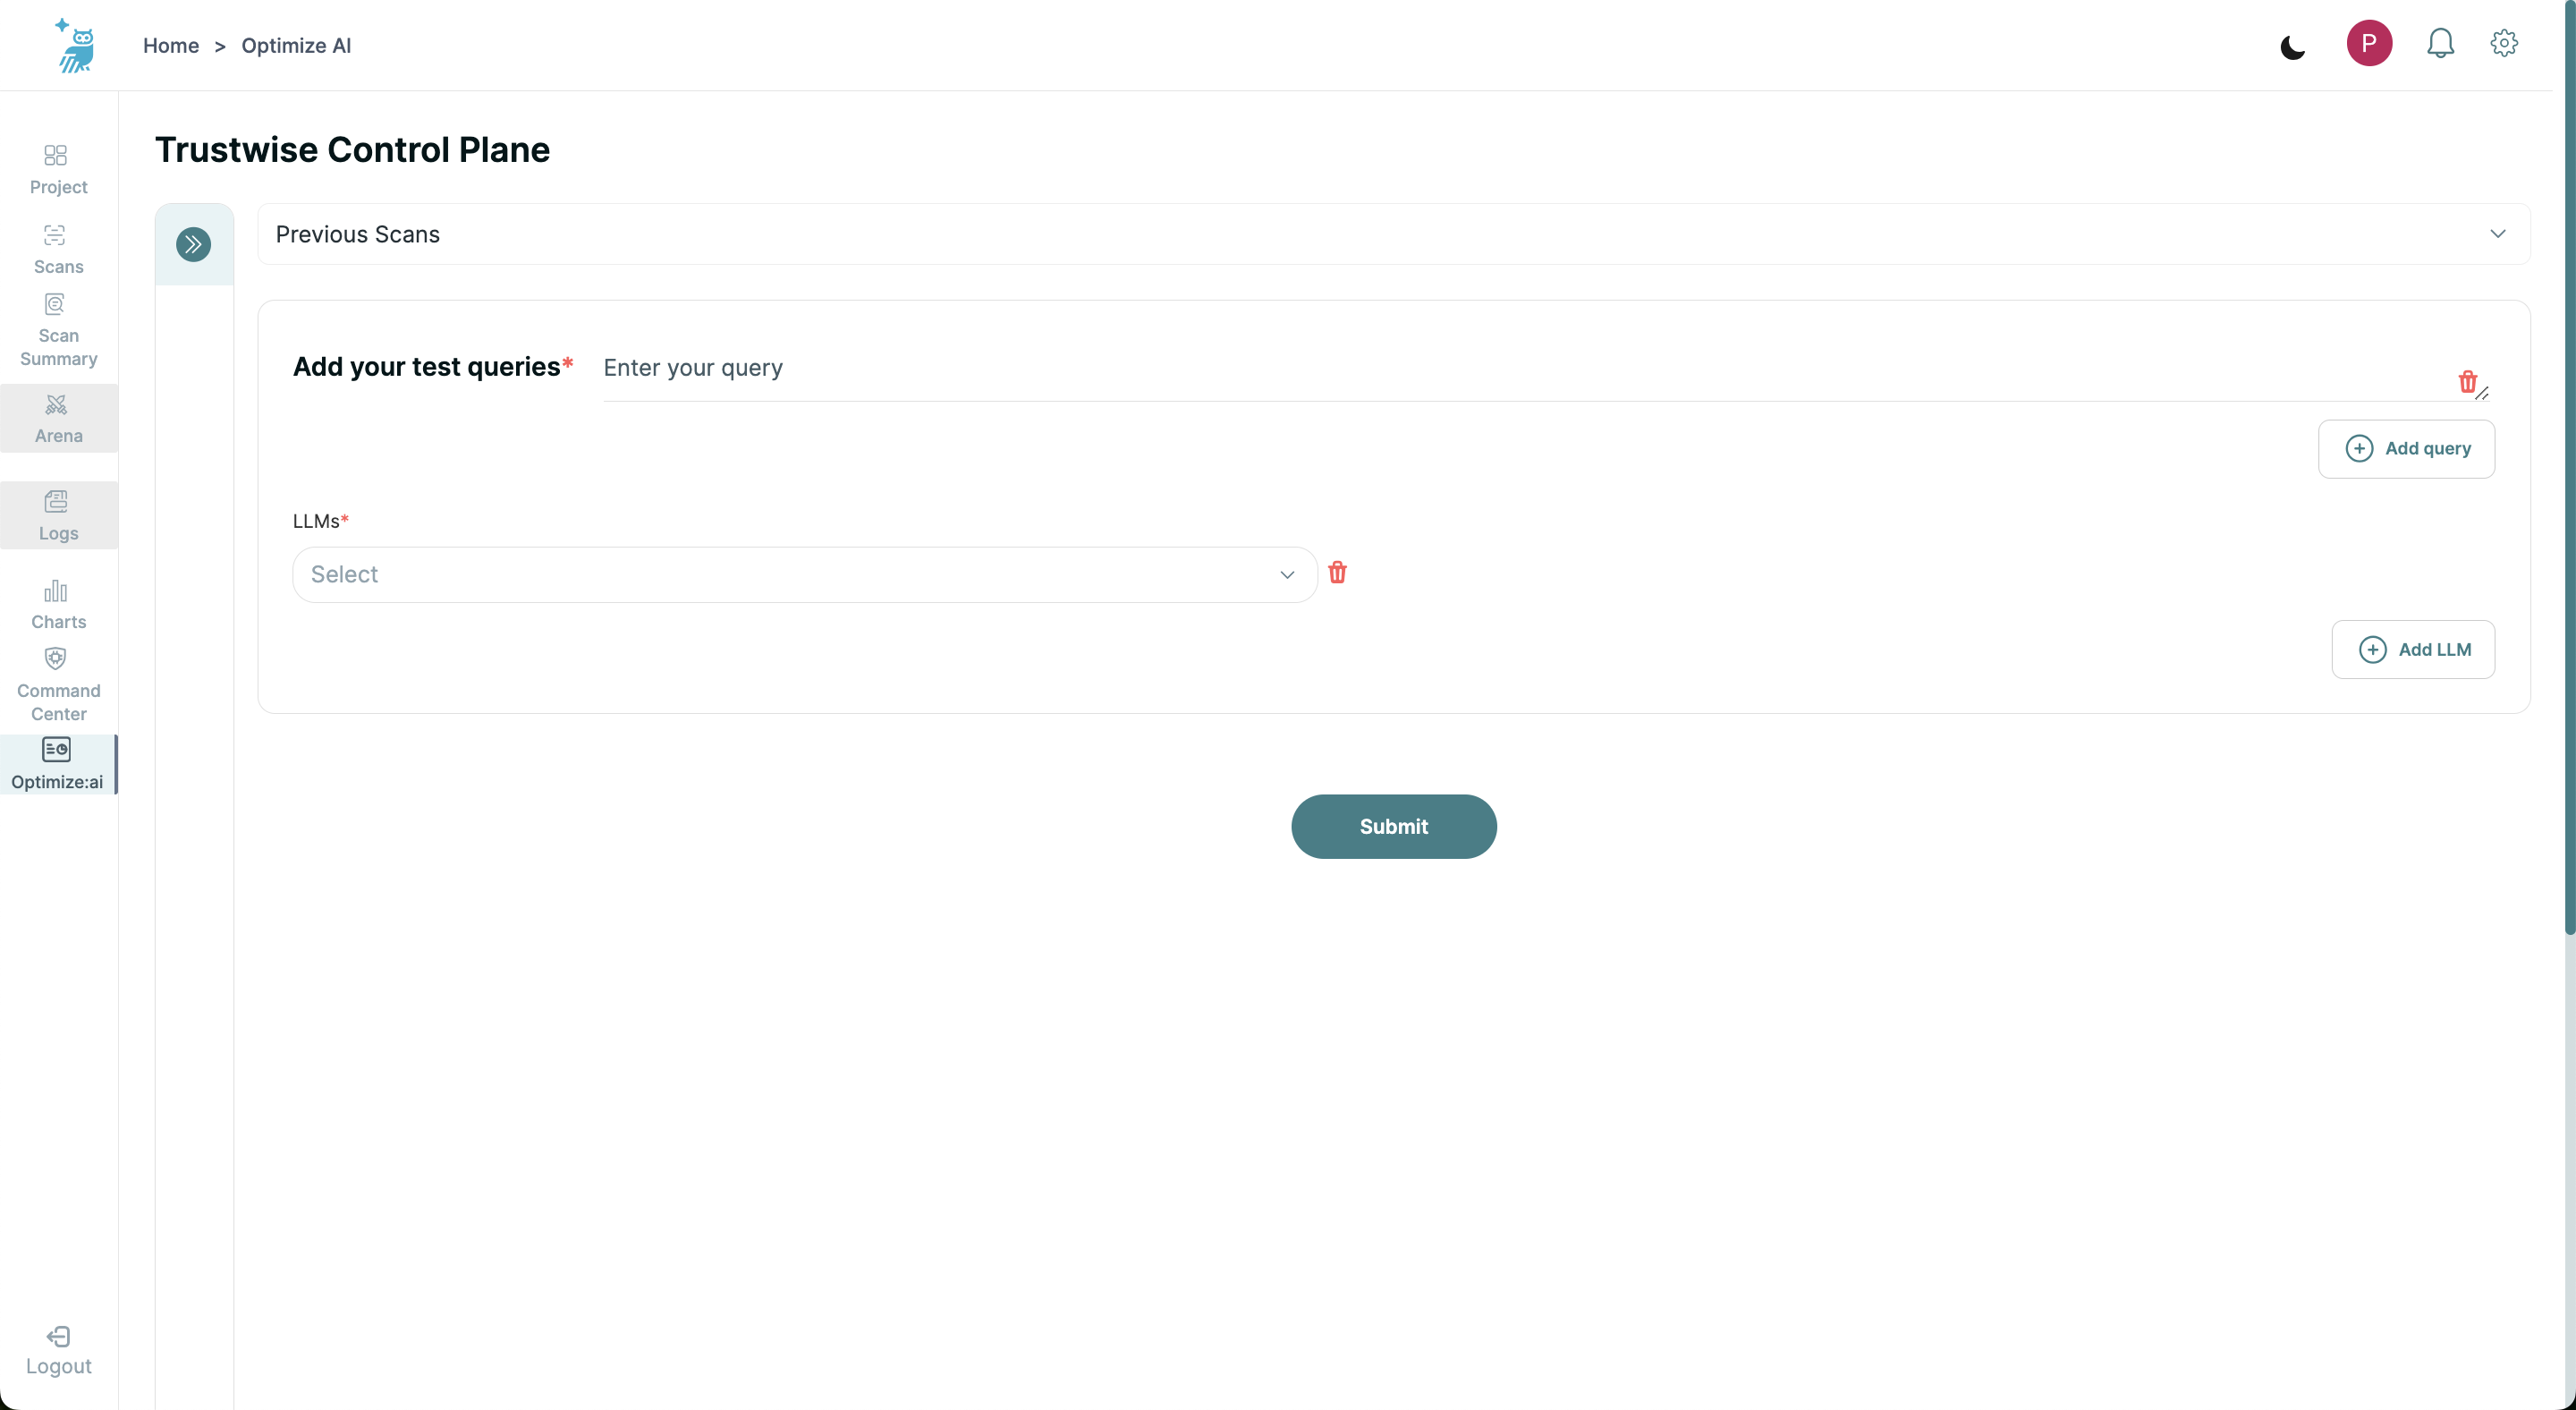
Minimize Configurations Panel
For a clearer view of the scan results, you can minimize the configurations tab on the left by clicking the blue button with arrows. This will expand the main panel where the results are displayed.
Step 2: View Previous Scans
Click on the 'Previous Scans' button to display a list of all your past scan activities.
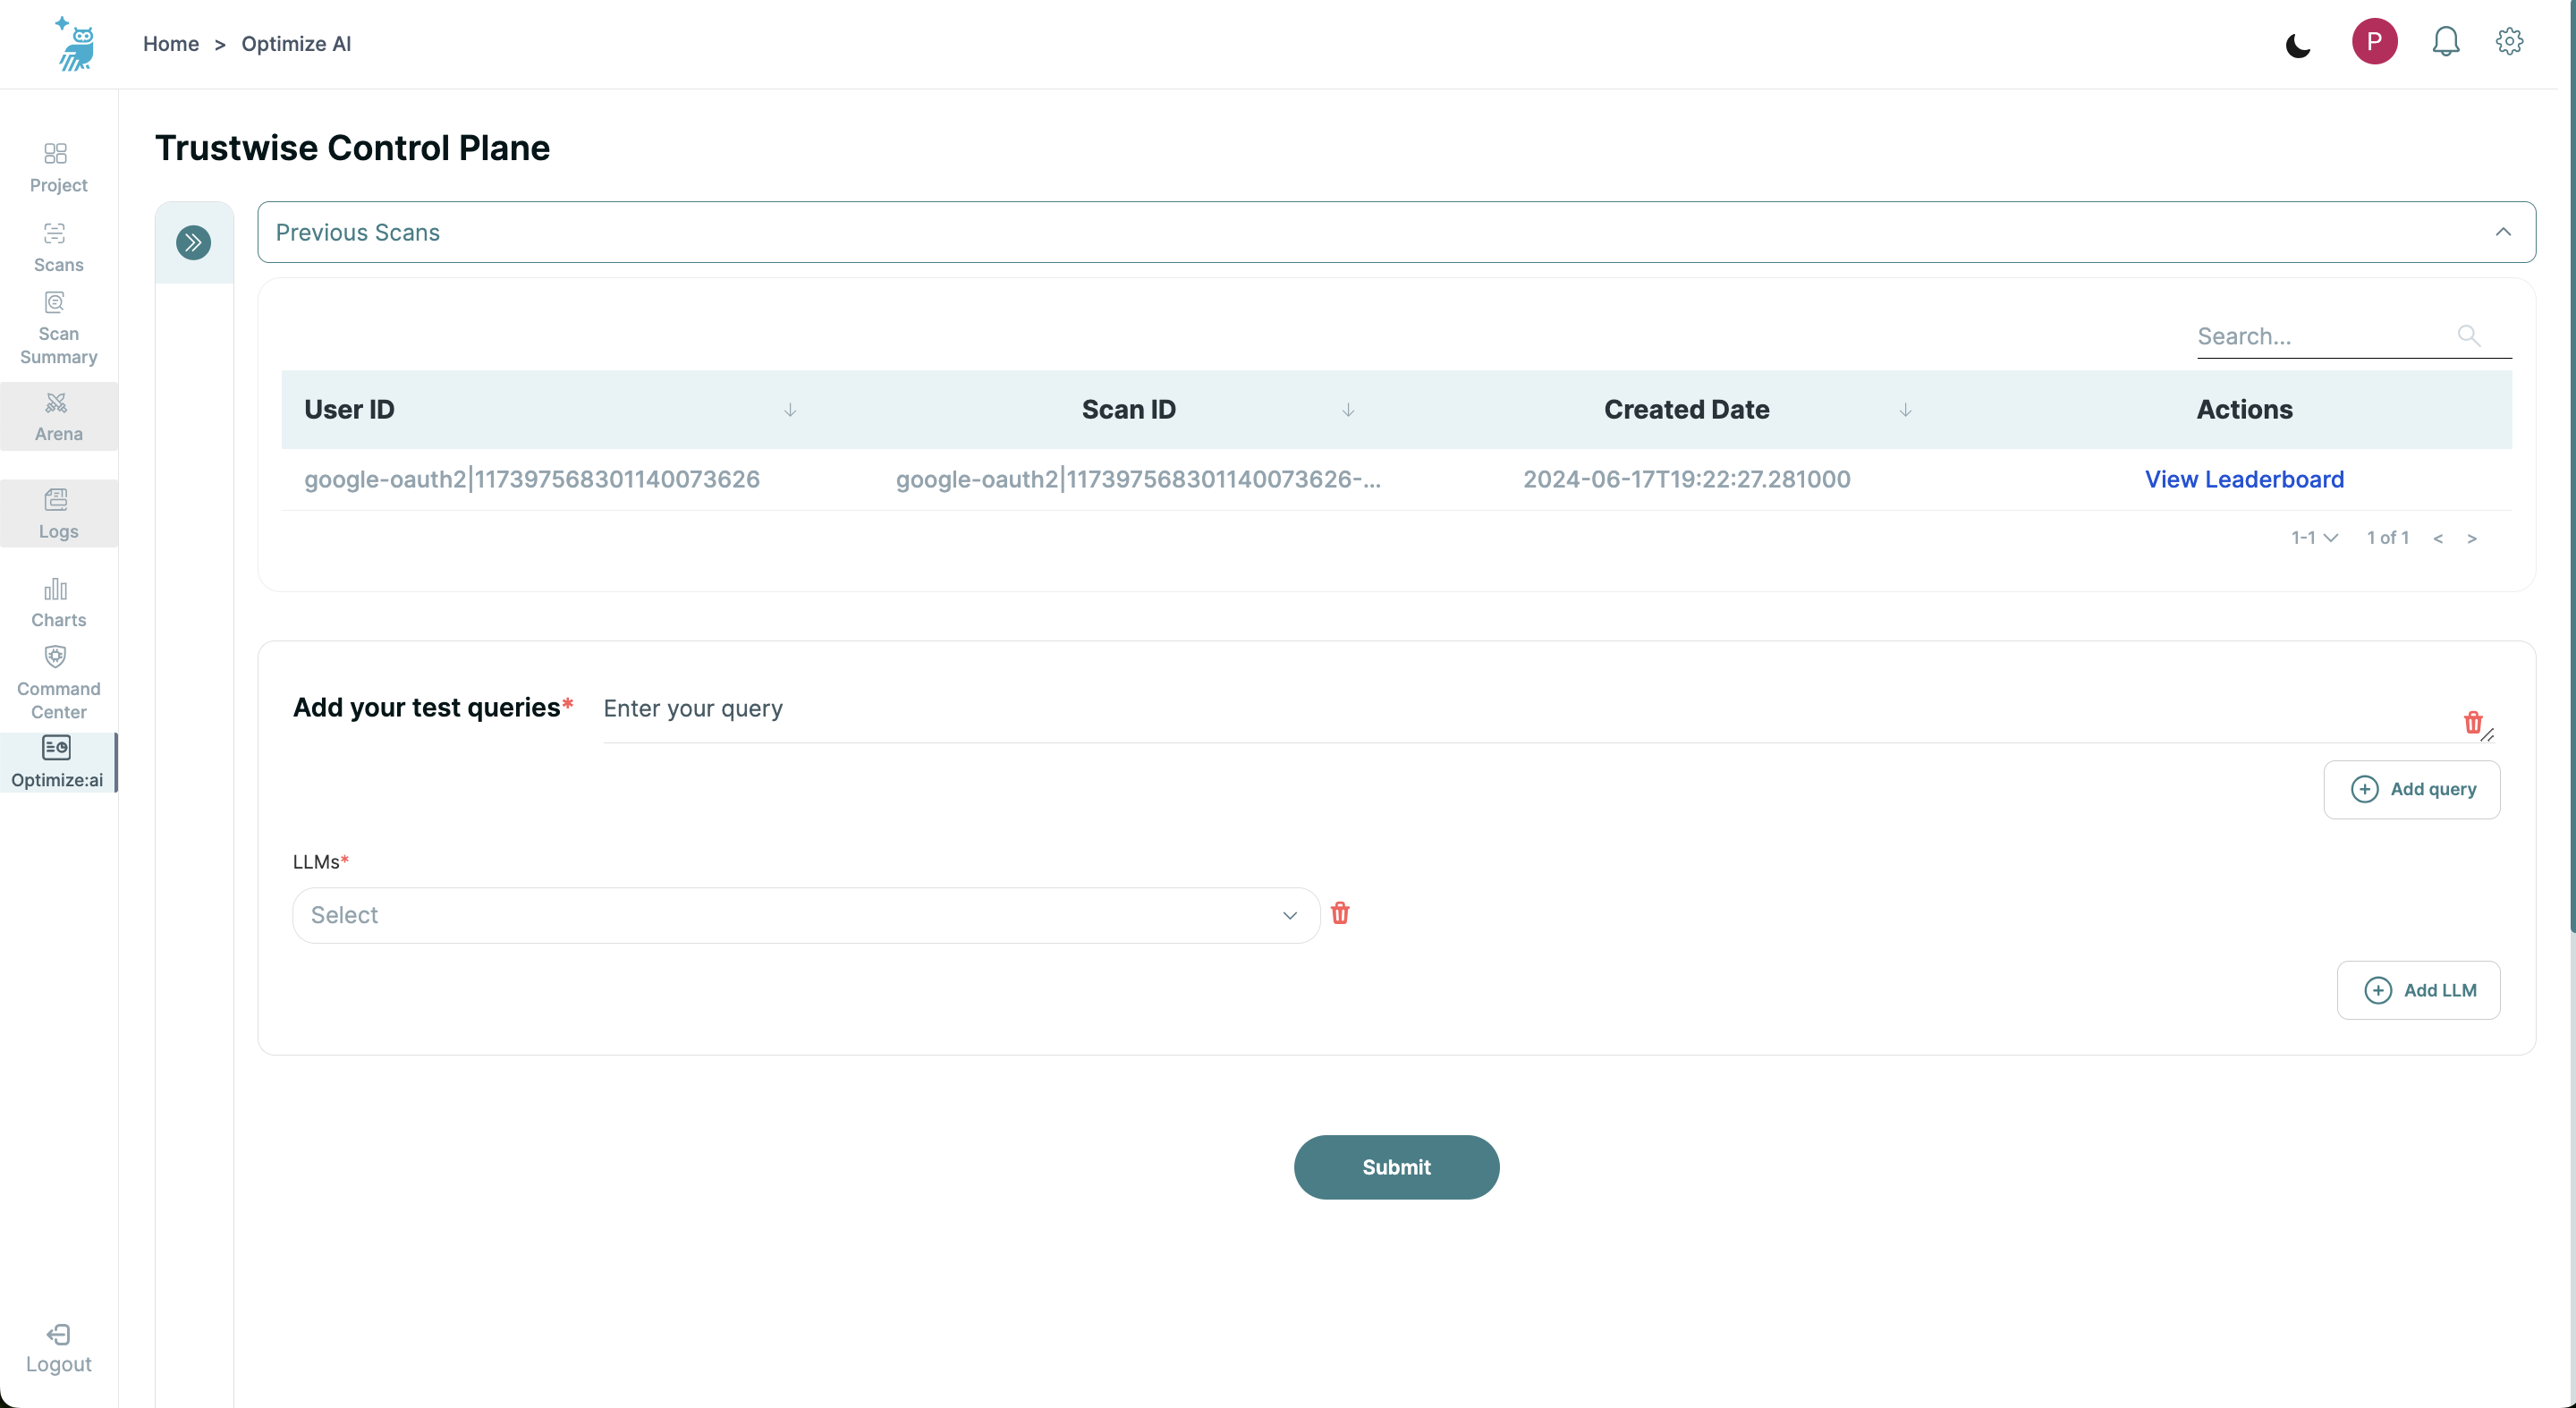
Step 3: Analyze Leaderboard and Results
Select the 'View Leaderboard' button next to the scan you wish to analyze. It may take a few seconds for the results to appear below the button.
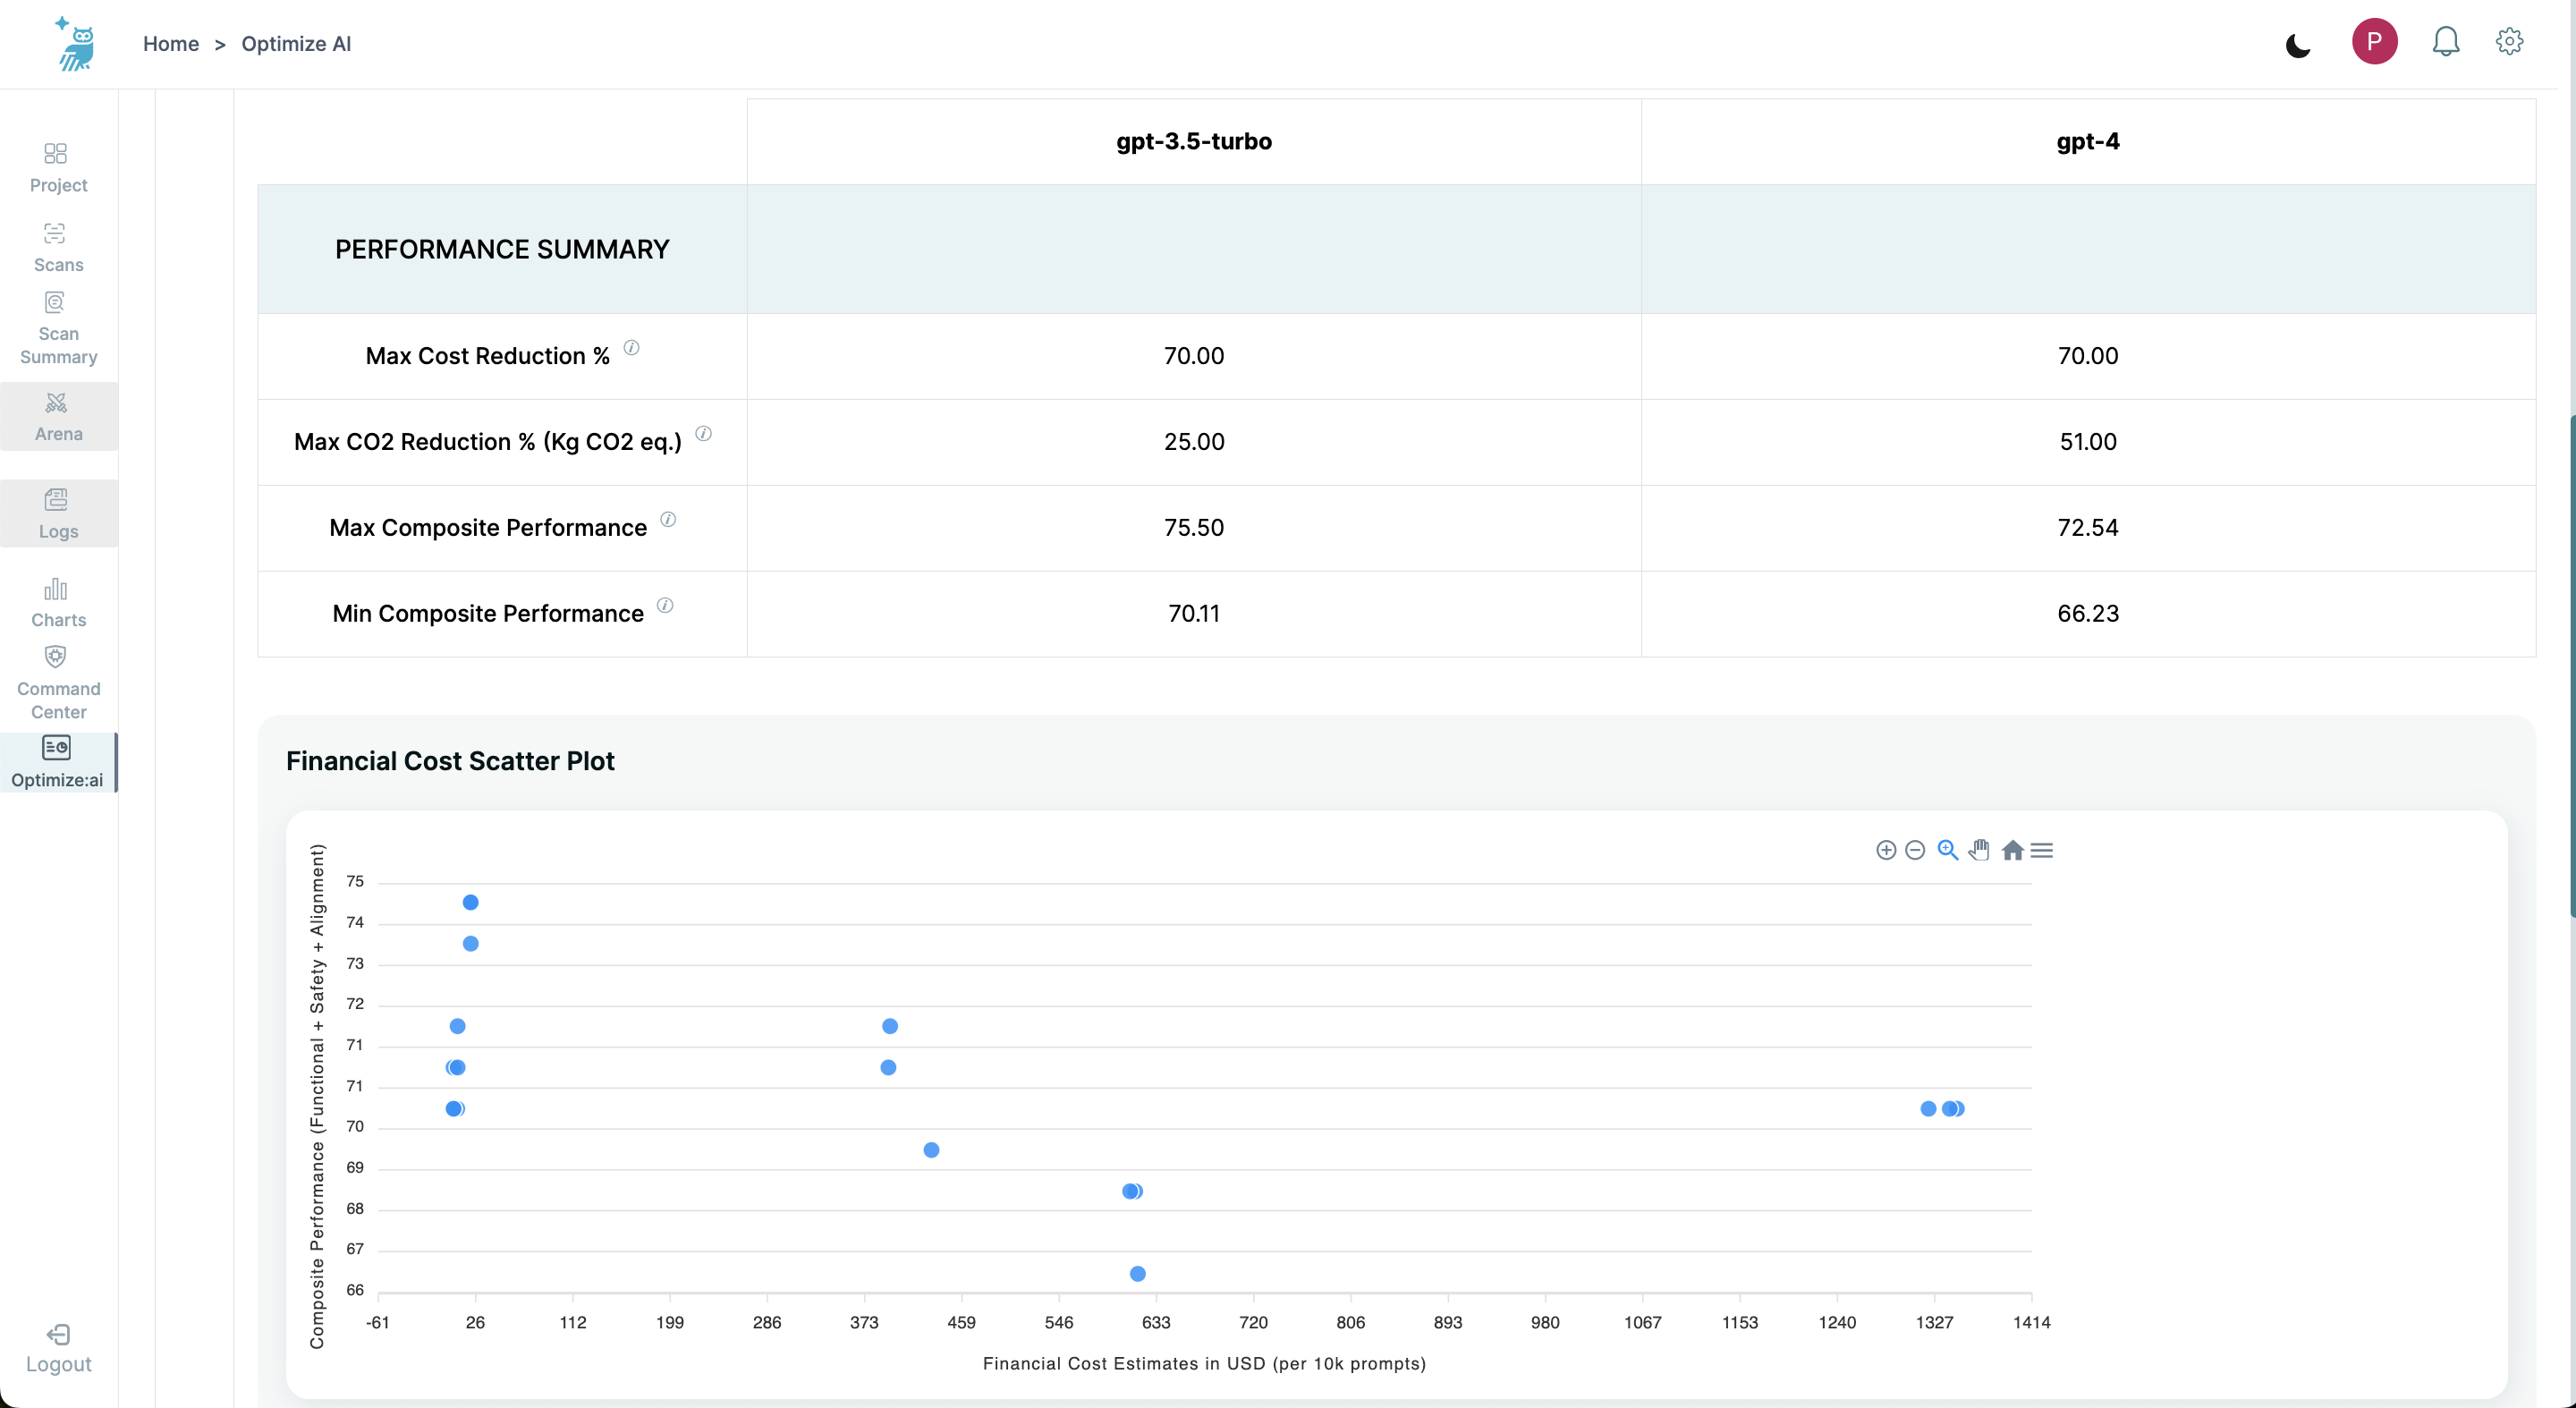
Performance Summary
At the top of the results, you will find the Performance Summary table, which includes:
- Max Cost Reduction %
- Max CO2 Reduction % (Kg CO2 eq.)
- Max Composite Performance
- Min Composite Performance
These metrics give a quick snapshot of each models's impact on performance and efficiency.
Financial Cost Scatter Plot
Below the summary, the Financial Cost Scatter Plot visualizes the relationship between financial cost and composite performance (functional, safety, and alignment) of each model.
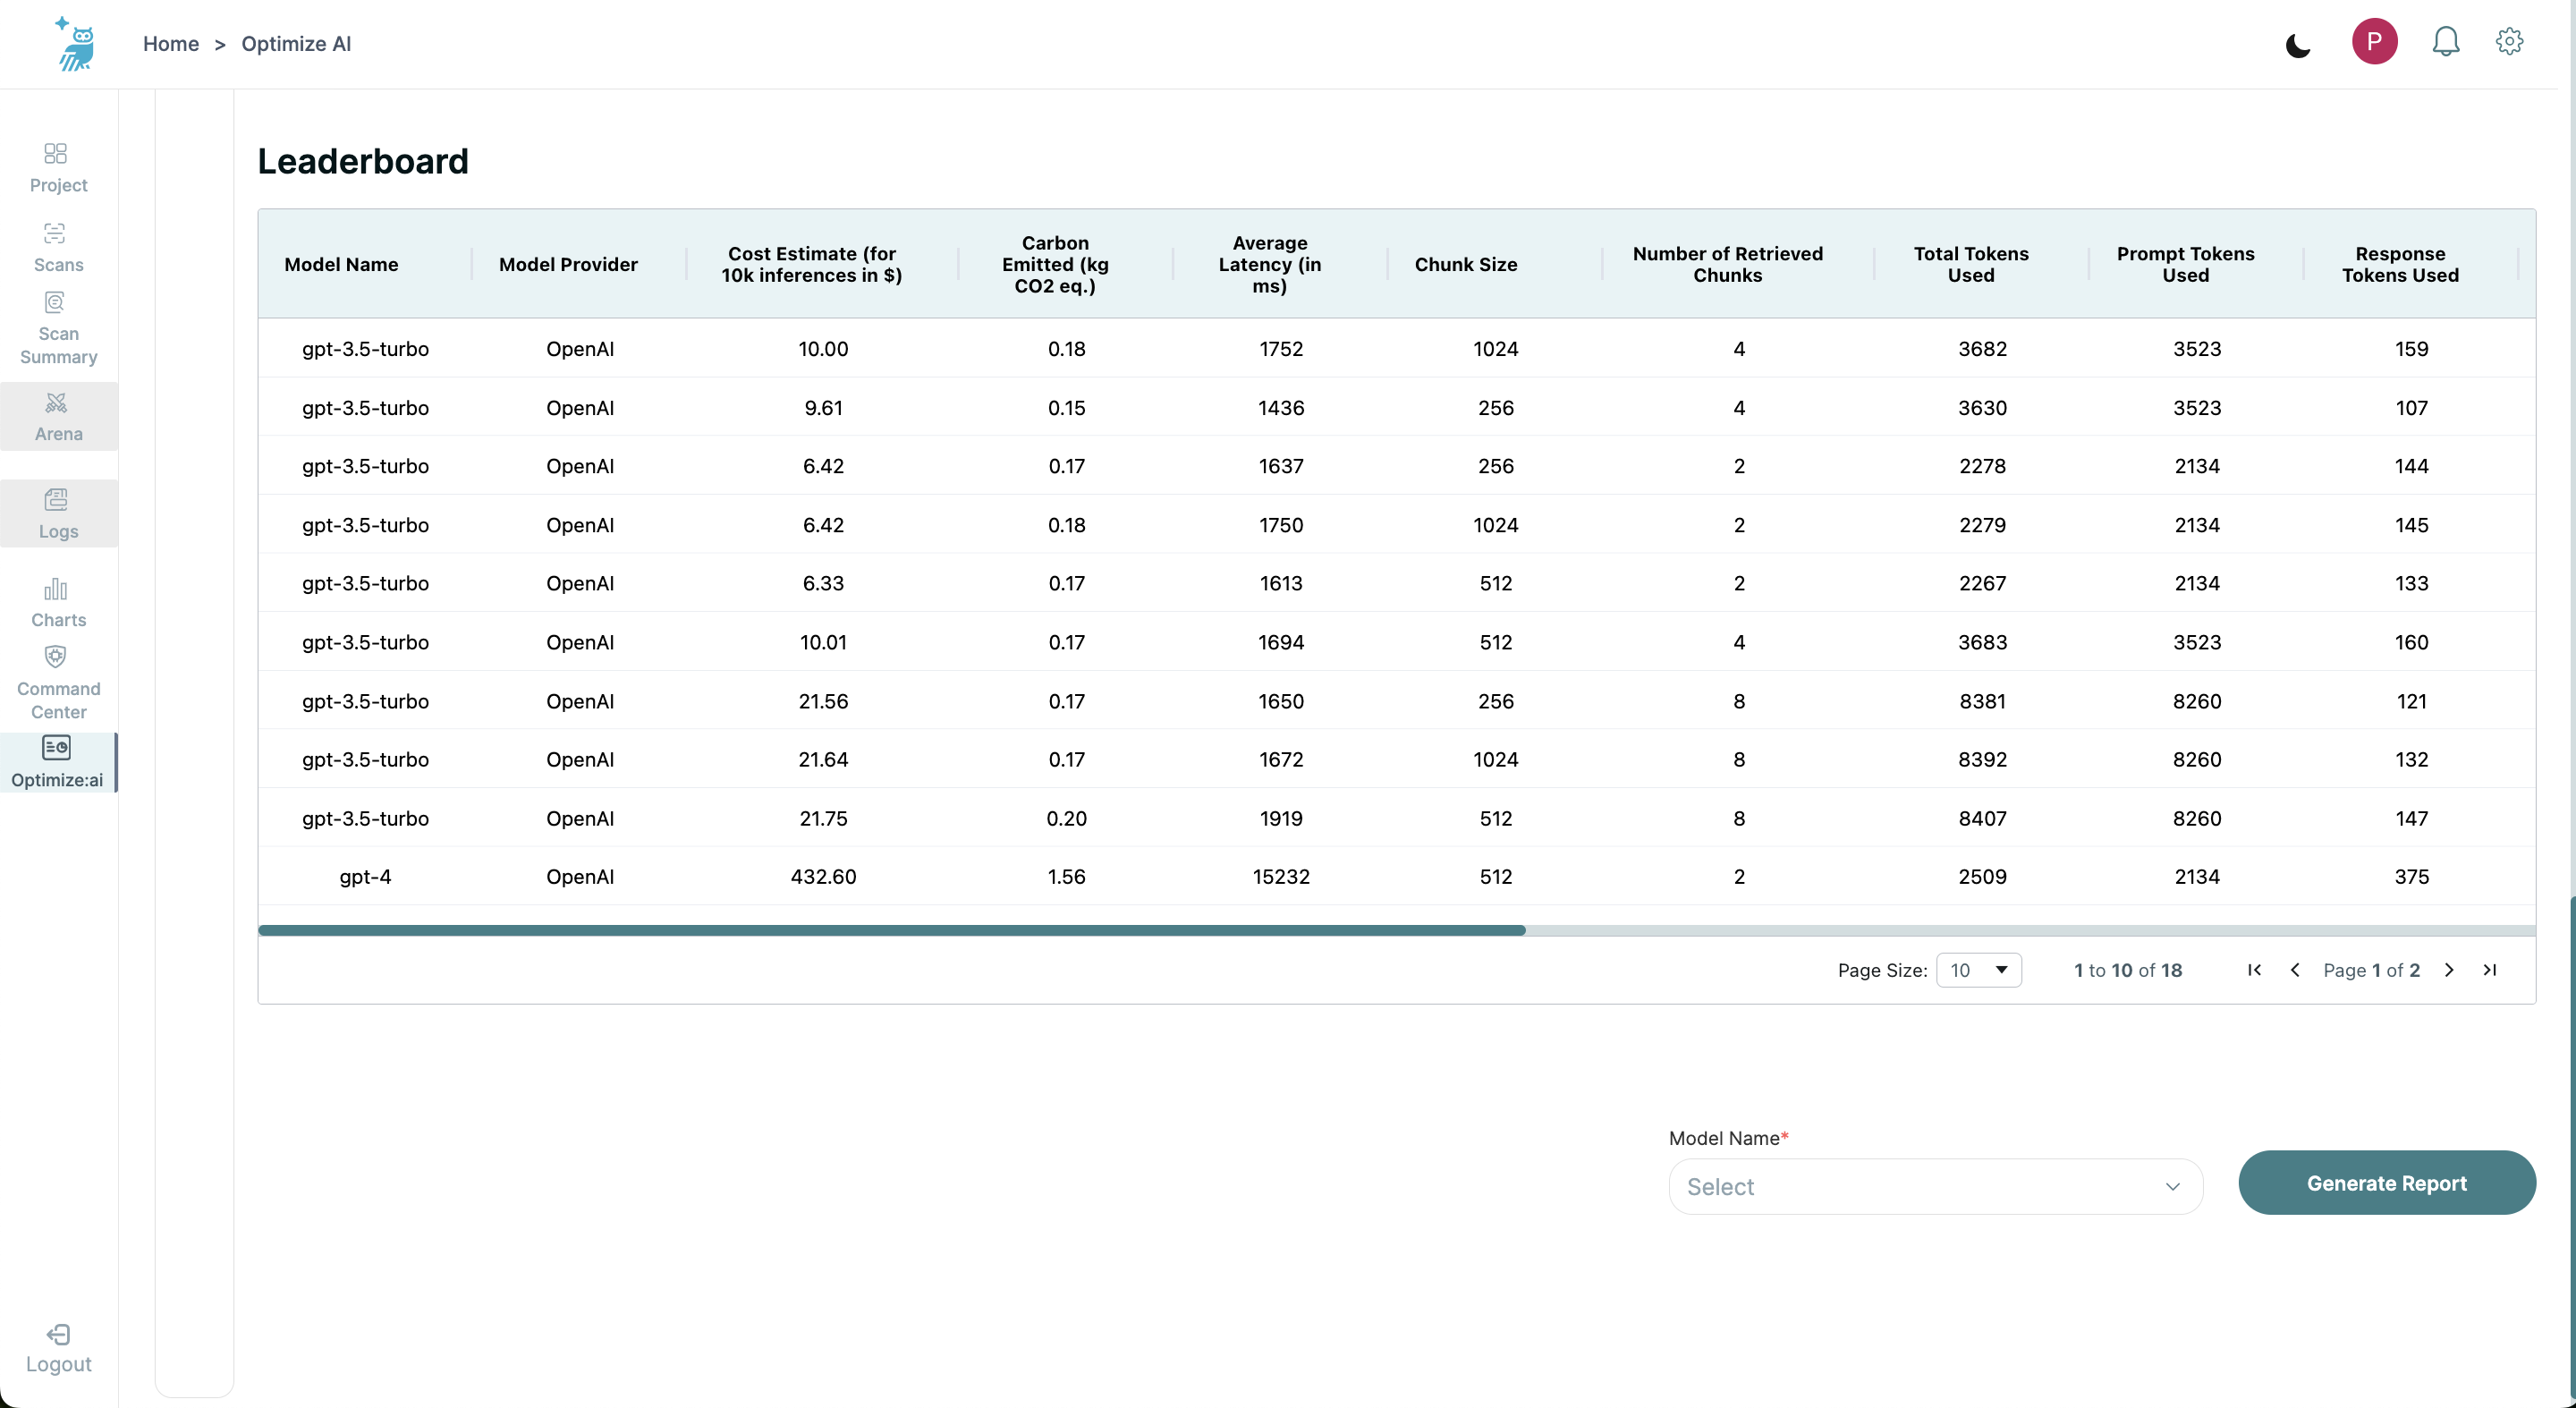
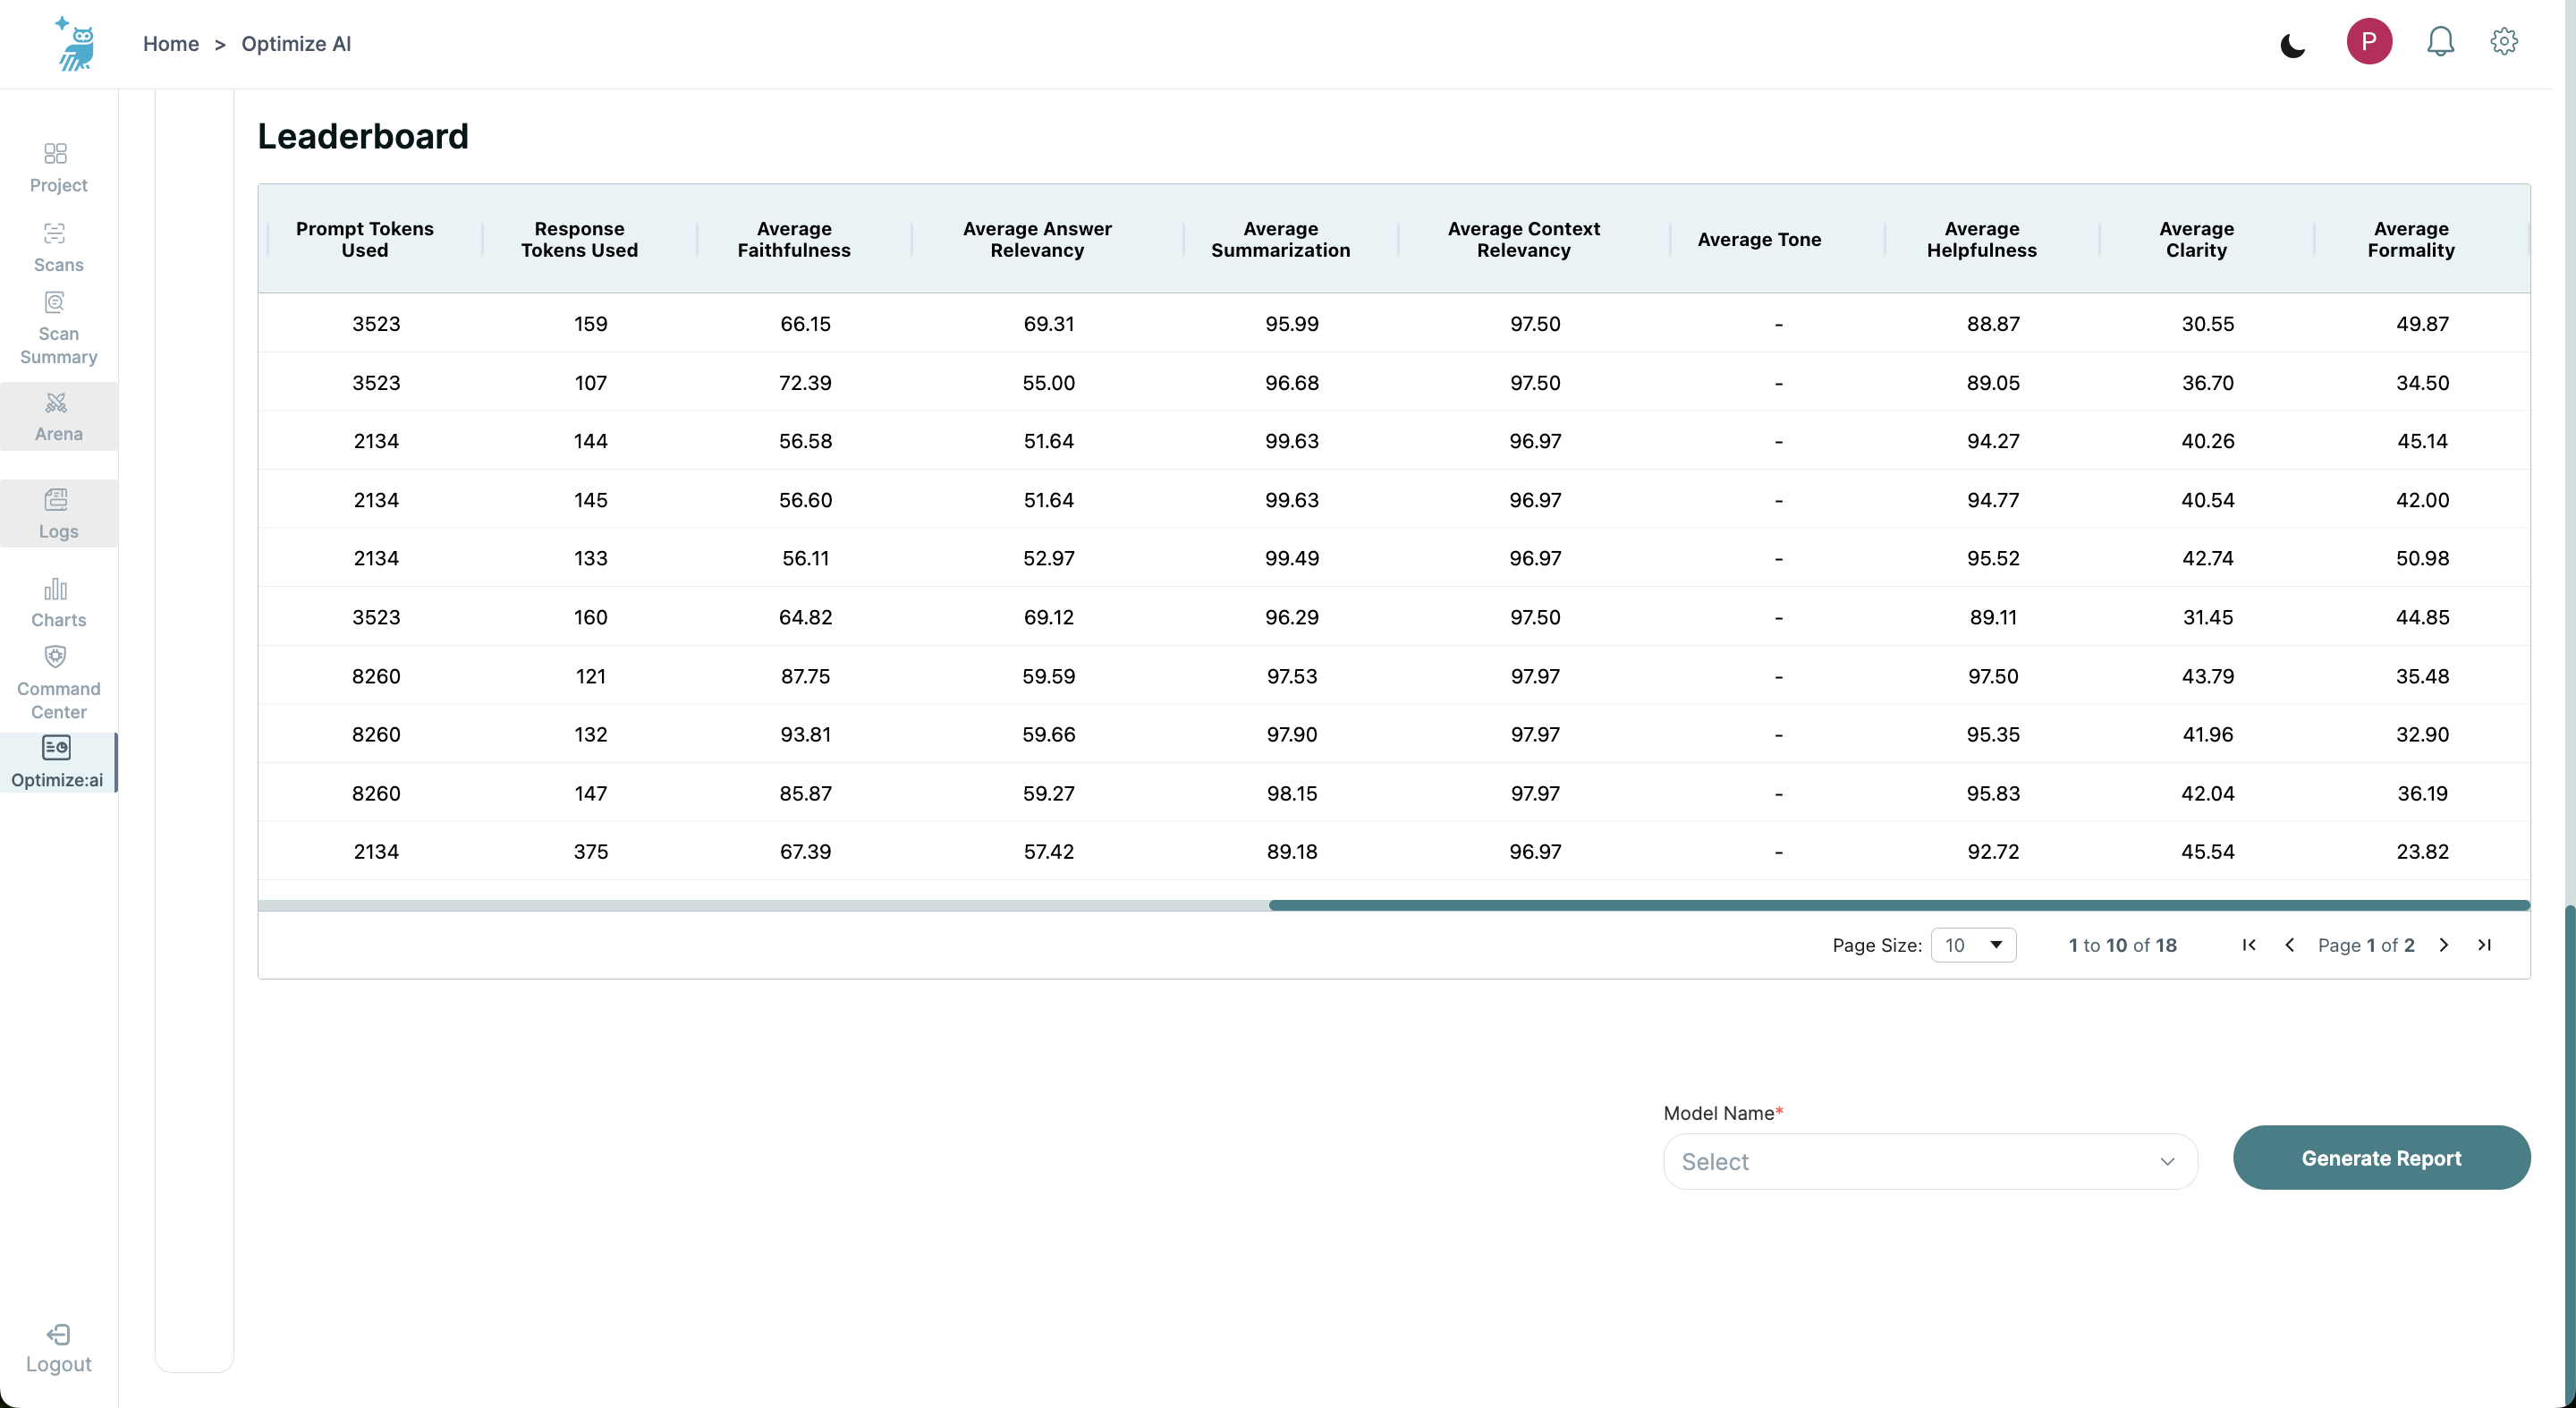
Detailed Leaderboard Table
The detailed leaderboard table provides extensive data on each model, including:
- Model name and Model provider
- Cost estimate for 10k inferences in USD
- Carbon emitted (kg CO2 eq.)
- Average latency (in ms)
- Chunk size - 256, 512, 1024
- Number of retrieved chunks - 2, 4, 8
- Total tokens used, Prompt tokens used, and Response tokens used
- Safety and Alignment Metrics including average Faithfulness, Answer Relevancy, Context Relevancy, Summarization, Simplicity, Helpfulness, Clarity, and Formality
The leaderboard allows for sorting by each column, providing a versatile view for detailed analysis.
Generating an Optimize:ai Scan Report
In addition to viewing Optimize:ai results, users can aslo generate detailed reports for their models. This guide will help you generate a comprehensive report for a selected model from the leaderboard.
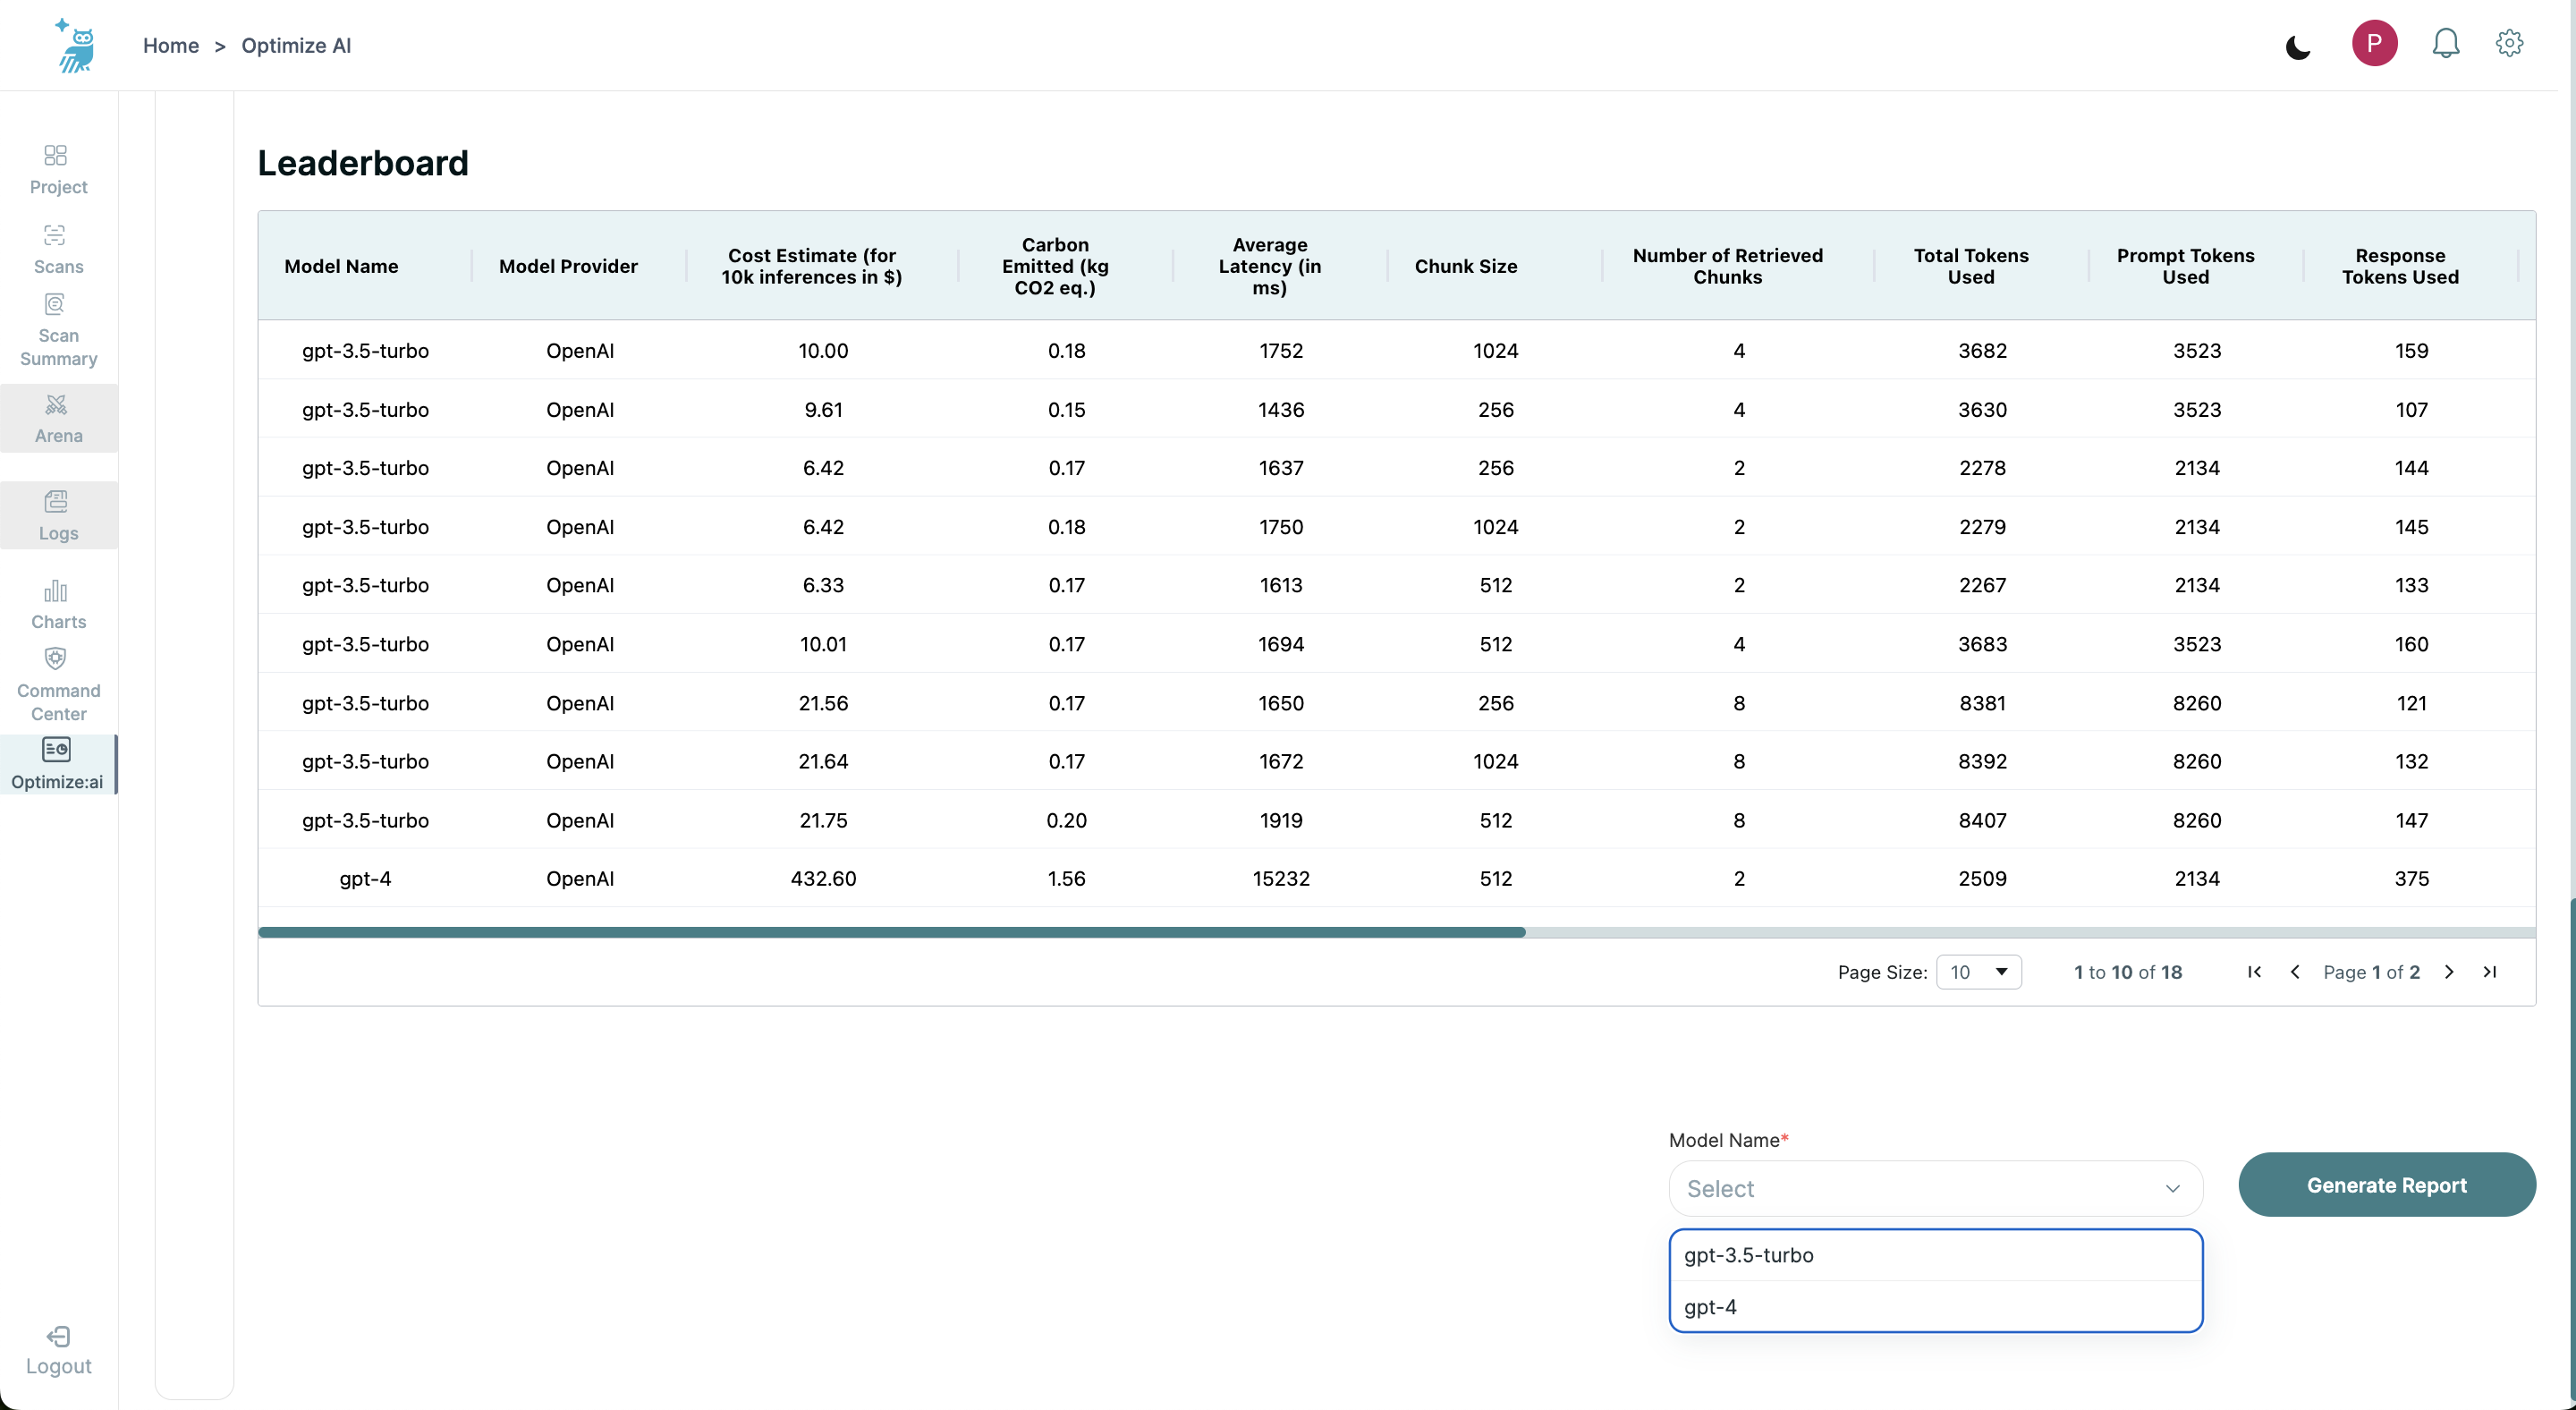
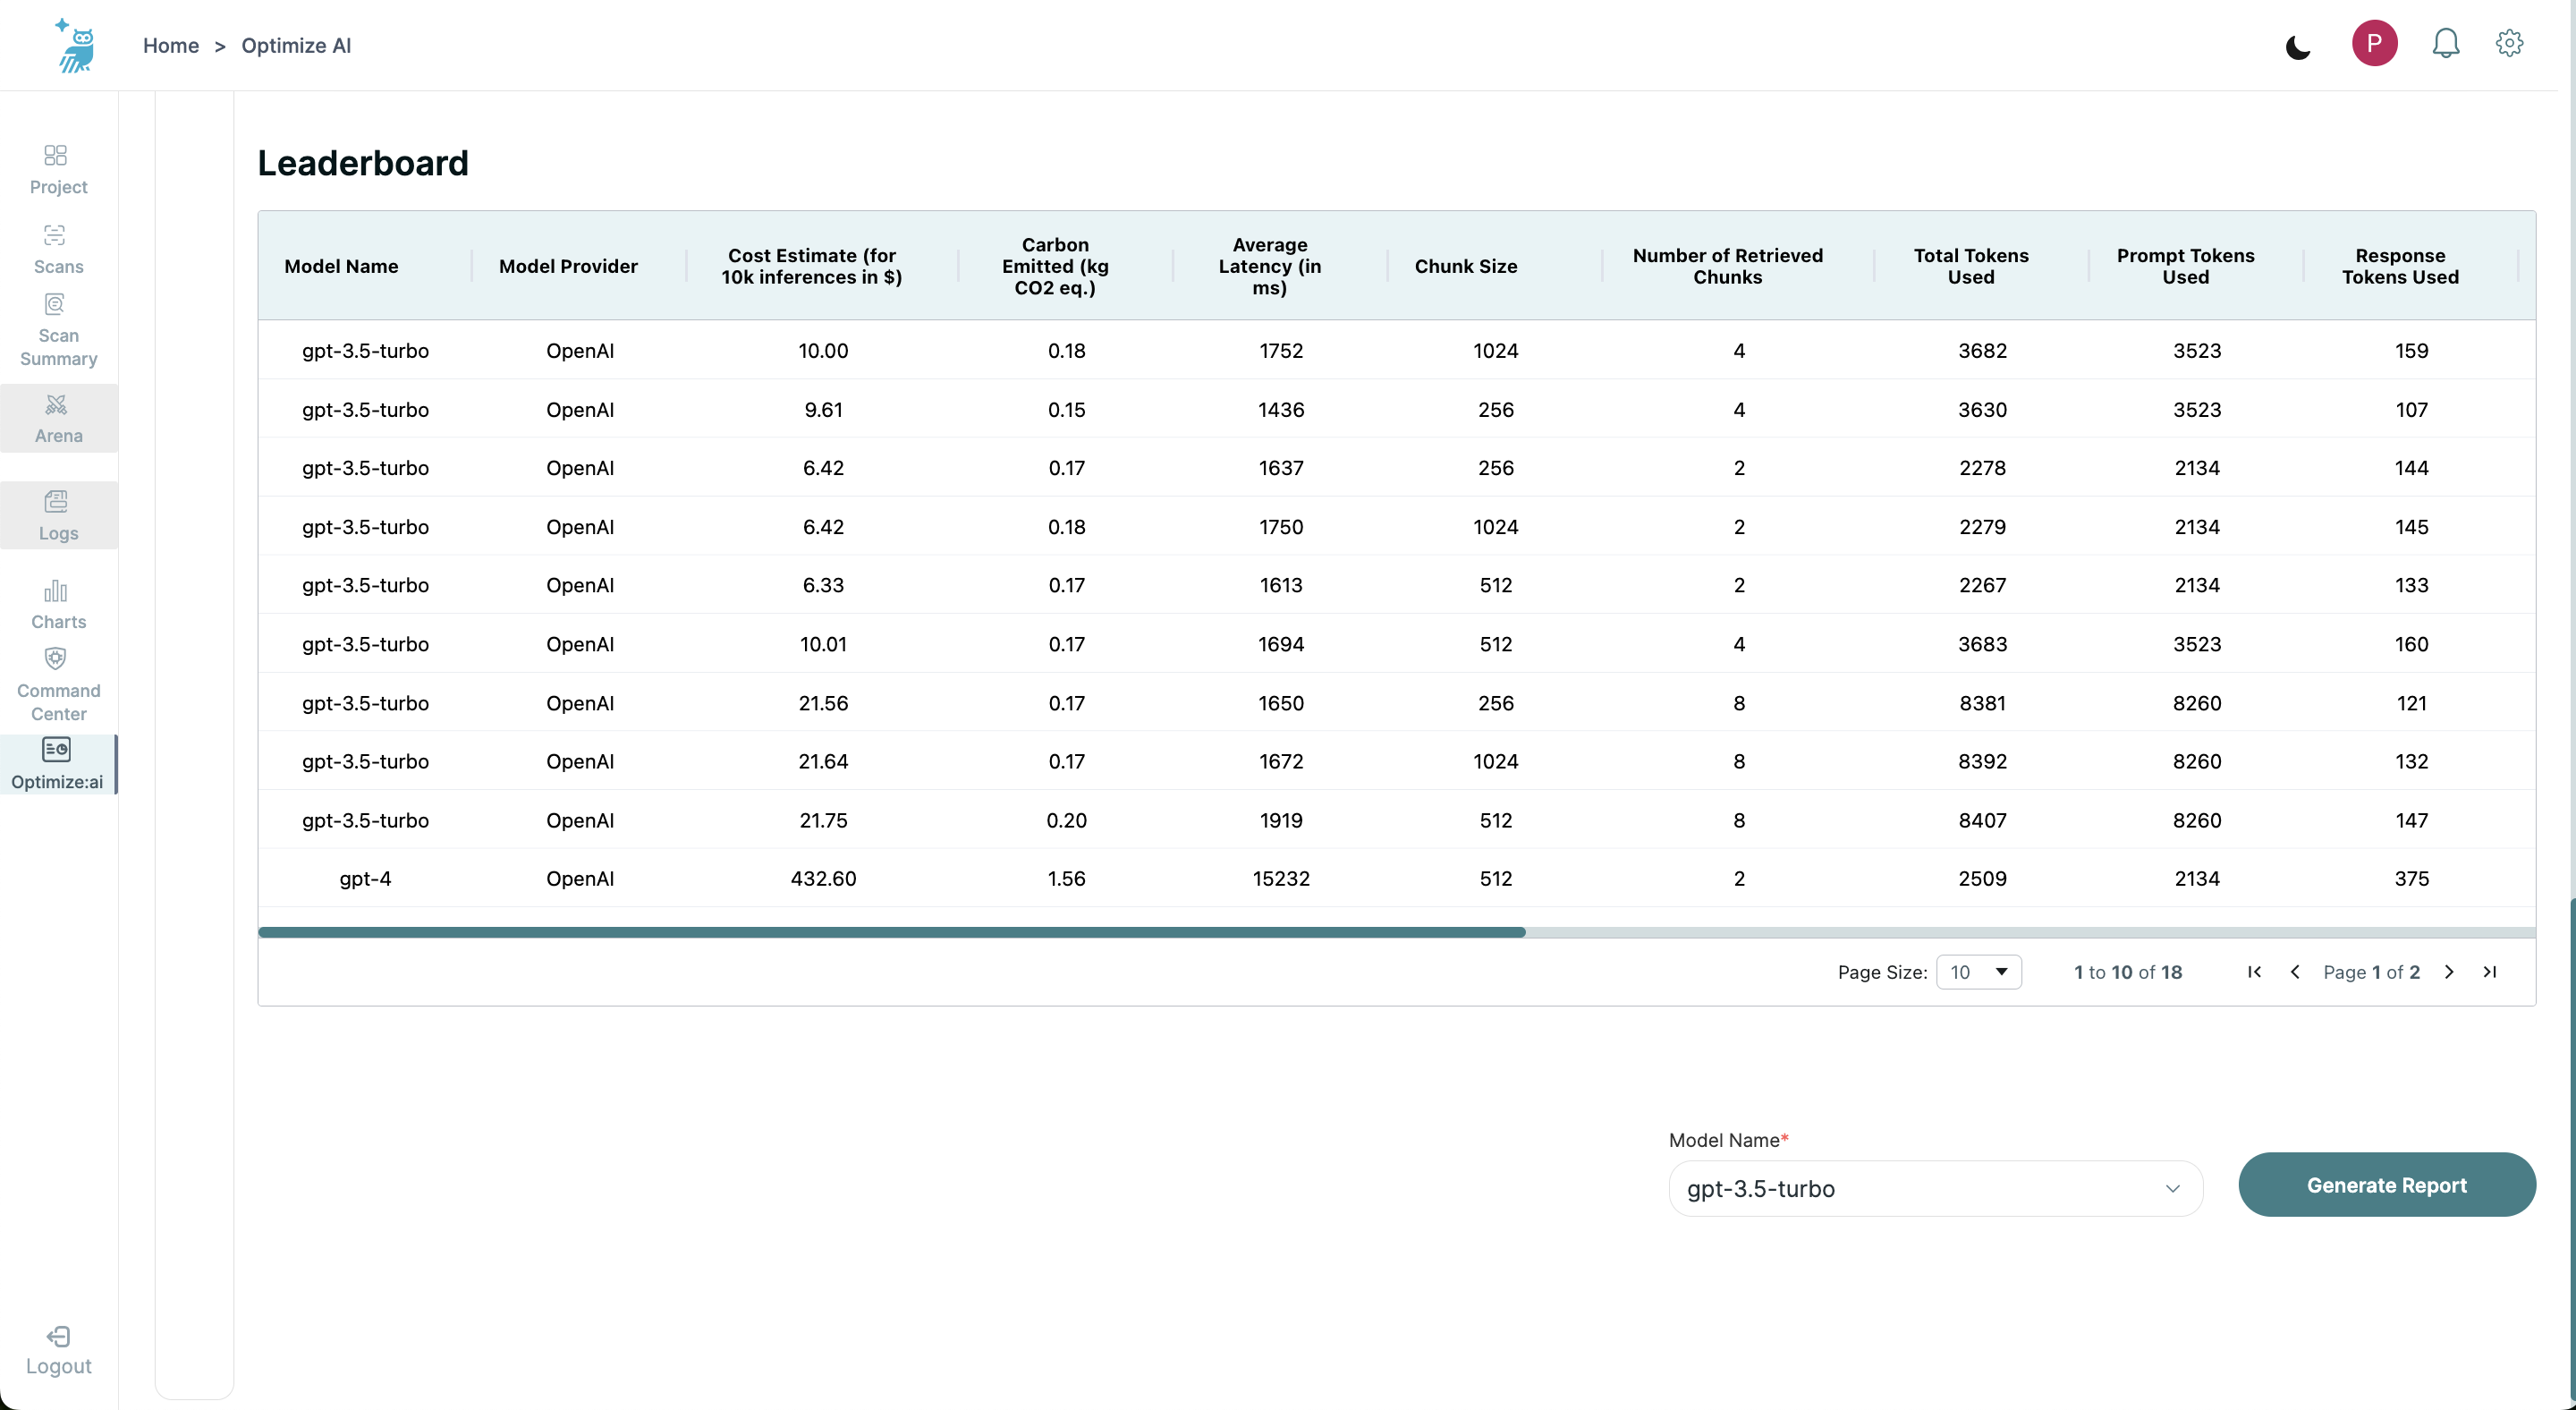
Step 1: Select Model from Leaderboard
After viewing the leaderboard, locate the dropdown menu below the leaderboard table. From this menu, select the model for which you wish to generate a report.
Step 2: Generate Report
Once the model is selected, click on the "Generate Report" button. The report generation may take a few seconds, after which it will be displayed on the screen.
Step 3: Review Generated Report
The generated report will include detailed information and metrics for the selected model. Below are the sections included in the report:
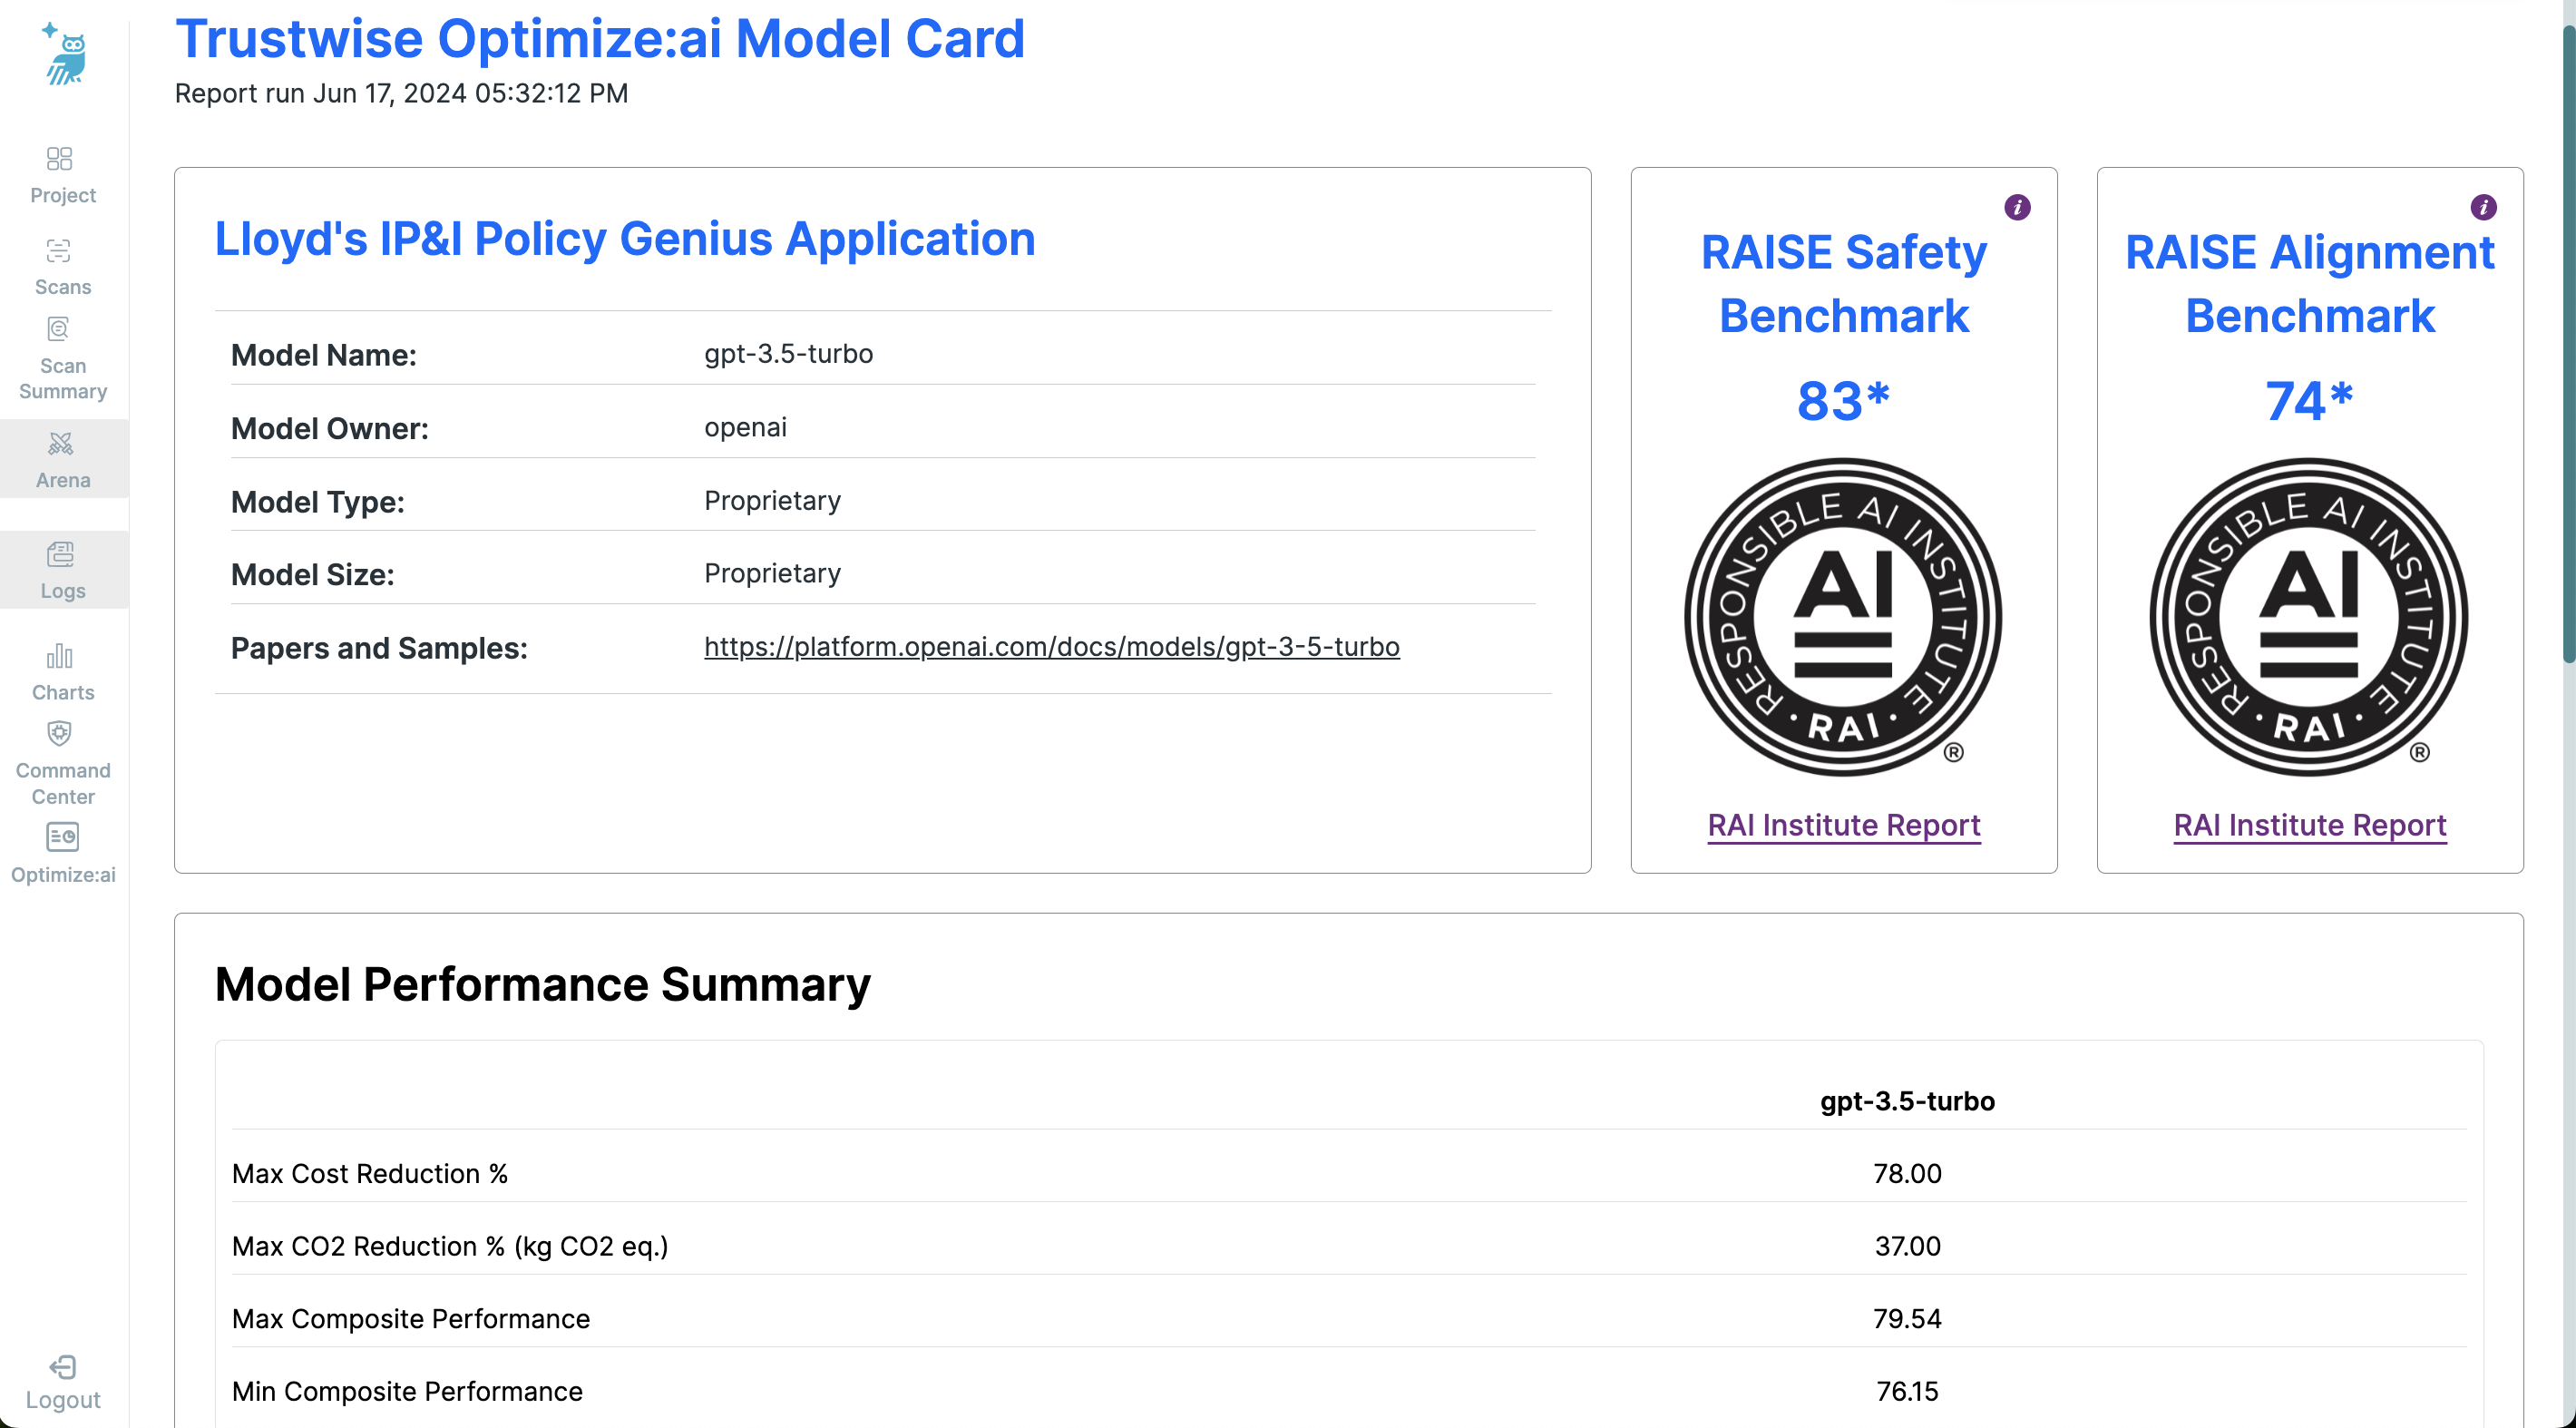
Model Information
- Model Name
- Model Owner
- Model Type
- Model Size
- Papers and Samples: Links to relevant documentation and sample outputs for the model.
Performance Benchmarks
- RAISE Safety Benchmark
- RAISE Alignment Benchmark
These benchmarks are provided in association with the RAI Institute, and links to detailed reports are included for deeper insights.
Performance Summary
At the top of the results, you will find the Performance Summary table, which includes:
- Max Cost Reduction %
- Max CO2 Reduction % (Kg CO2 eq.)
- Max Composite Performance
- Min Composite Performance
These metrics give a quick snapshot of each models's impact on performance and efficiency.
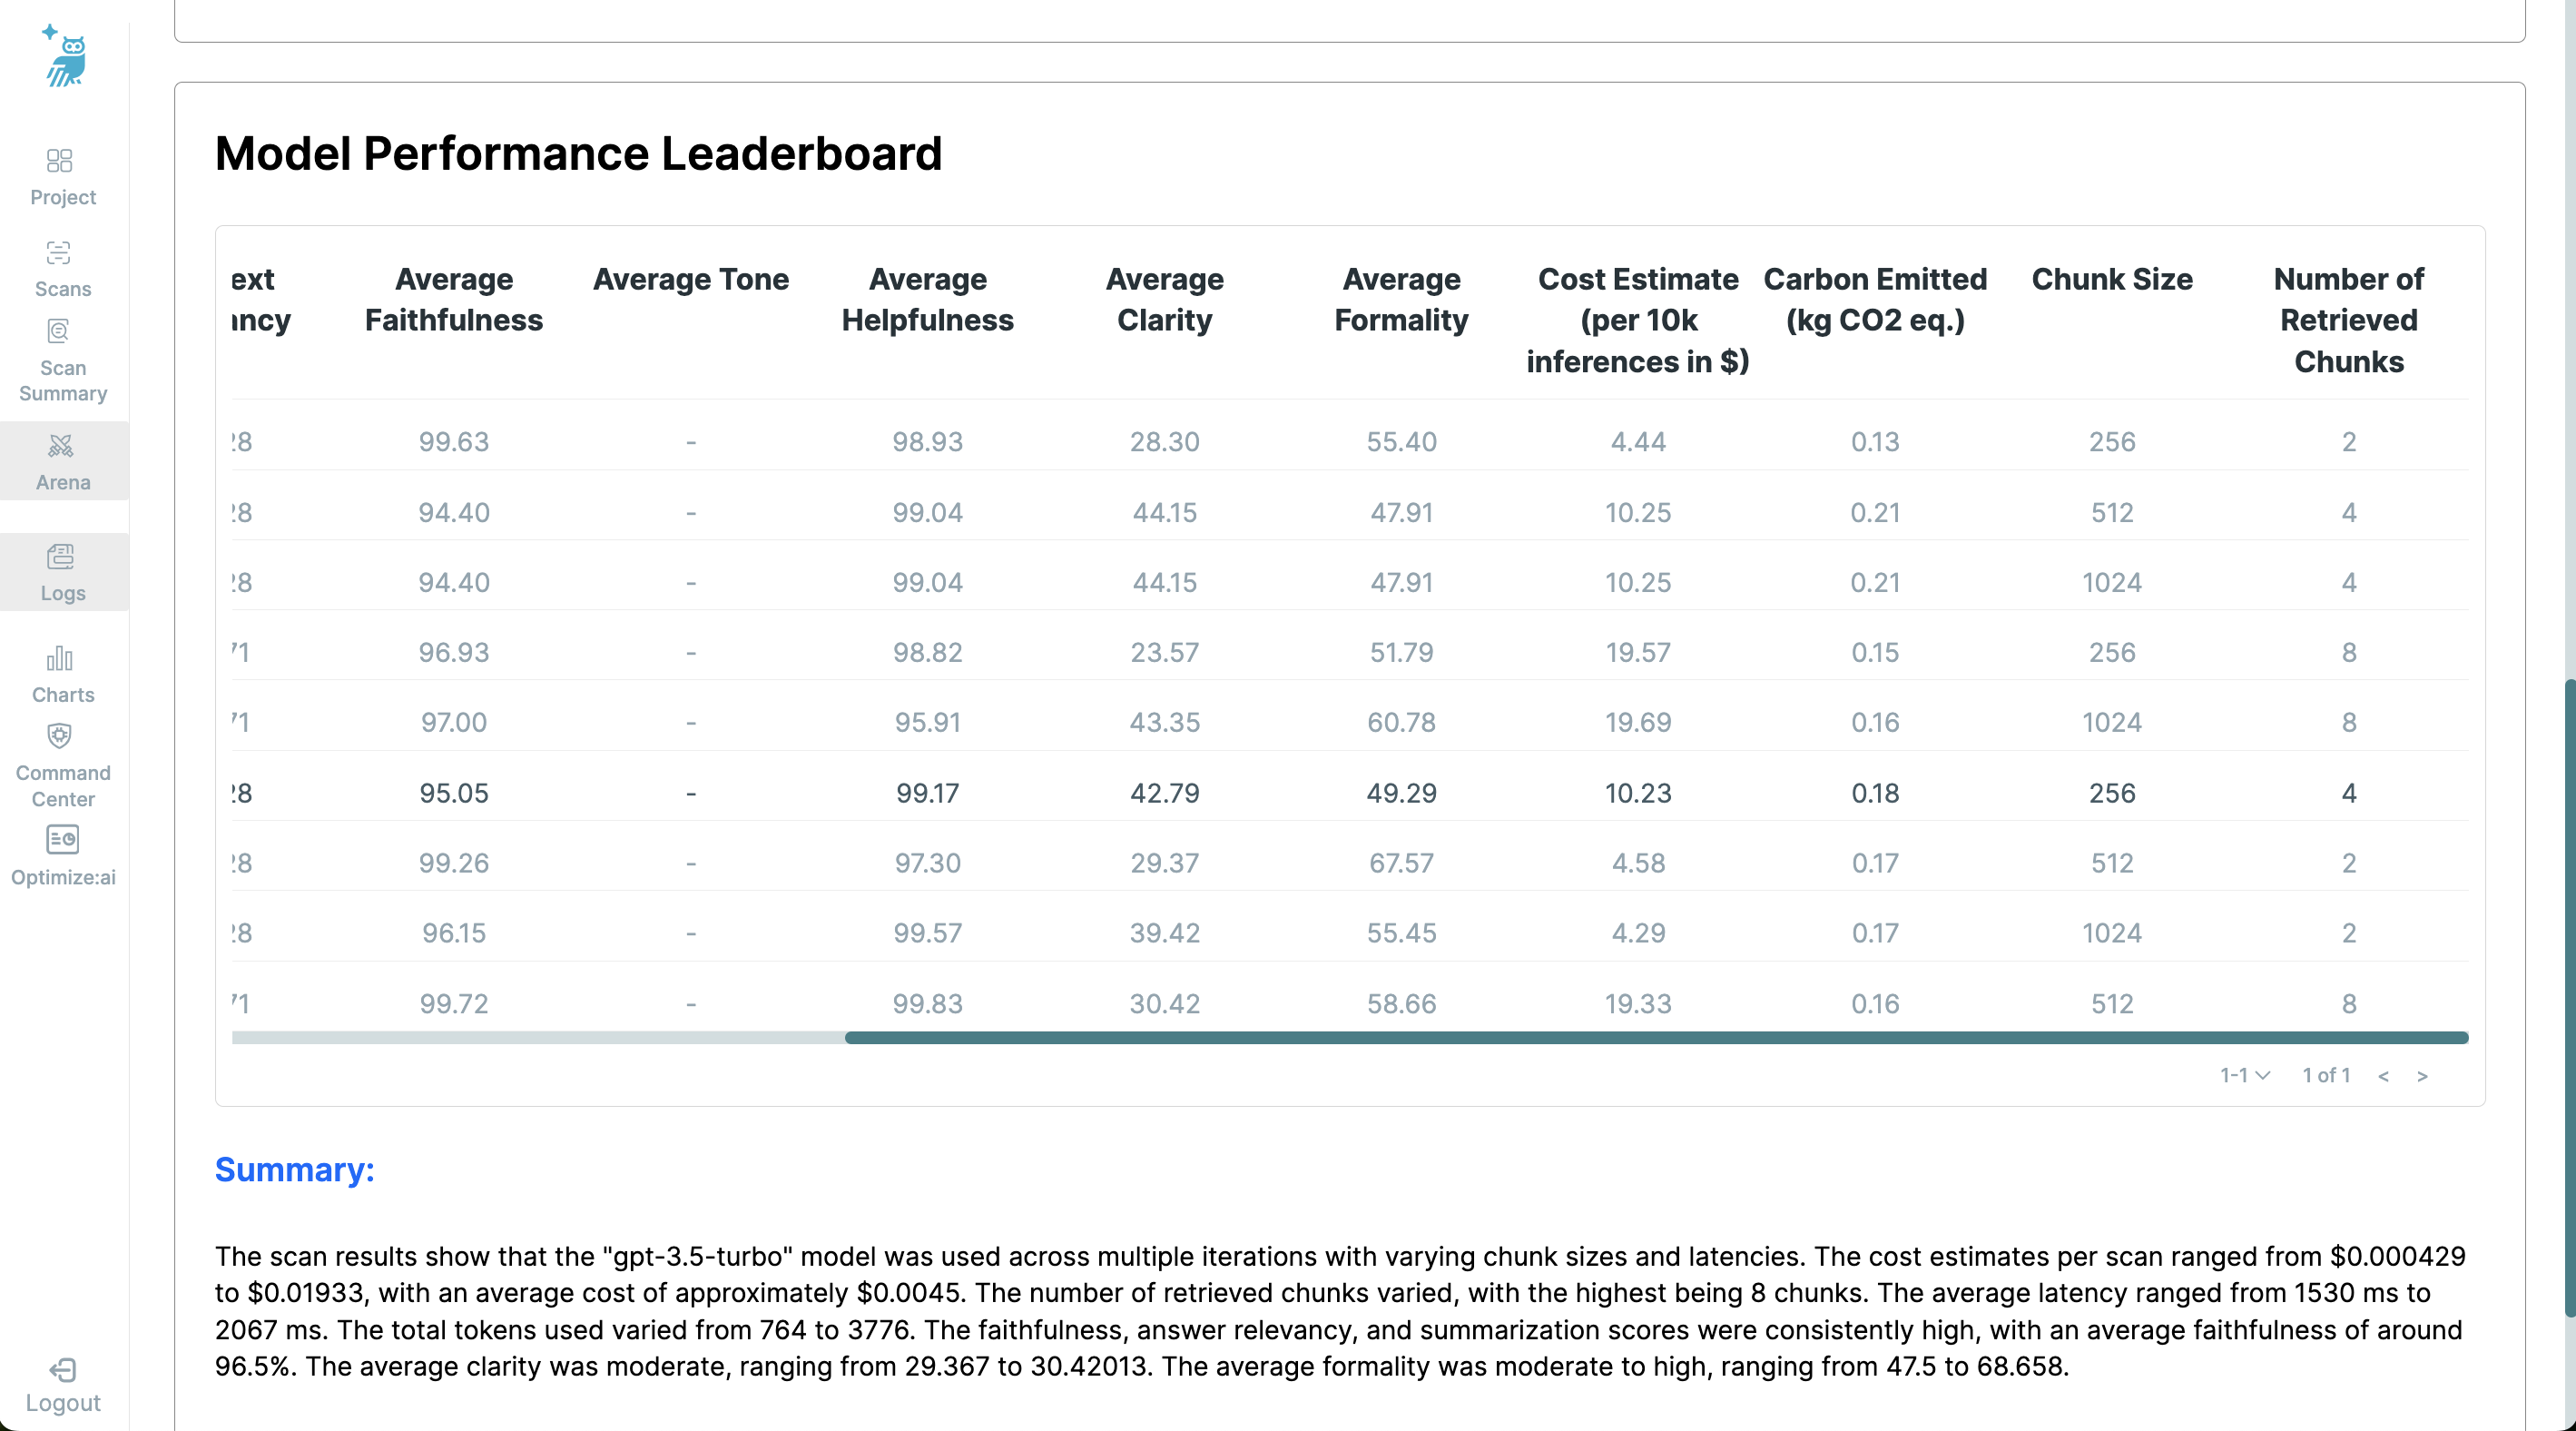
Detailed Leaderboard Table
The detailed leaderboard table provides extensive data on each model, including:
- Model name and Model provider
- Cost estimate for 10k inferences in USD
- Carbon emitted (kg CO2 eq.)
- Average latency (in ms)
- Chunk size - 256, 512, 1024
- Number of retrieved chunks - 2, 4, 8
- Total tokens used, Prompt tokens used, and Response tokens used
- Safety and Alignment Metrics including average Faithfulness, Answer Relevancy, Context Relevancy, Summarization, Simplicity, Helpfulness, Clarity, and Formality
Summary of Findings
This final section provides a summary of the key findings from the Optimize:ai scans, offering a high-level overview of the model's performance across various metrics and configurations. The insights gained from the detailed leaderboard analysis are encapsulated here, highlighting the overall efficiency, reliability, and operational cost-effectiveness of the model under test.
This summary is designed to assist stakeholders in quickly grasping the significant outcomes and implications of the scan results, facilitating informed decision-making regarding the future utilization and optimization of the model.
Safety Metrics Details
Summarization
Summarization evaluates the response using the context and aims to determine whether the response is factually consistent with respect to the provided context. The response is split into individual sentences and all (context, sentence) pairs are passed through a fine-tuned model, determining whether the contents of the sentence are supported by the provided context. This process results in a Summarization metric, scored between 0 and 100, with higher scores indicating that more of the claims in the response are supported by the context.
Faithfulness
Faithfulness evaluates the response using the context and aims to determine whether the response is free from any false statements based on the provided context. The response is broken down into ‘atomic’ facts, which contain only one piece of information. Each of these facts is then verified with respect to the context. This process results in a Faithfulness metric, scored between 0 and 100, with higher scores indicating that a higher proportion of the claims in the response are supported by the context.
Context Relevancy
Context Relevancy evaluates the context using the query and aims to assess whether the context contains all the information necessary to answer the query. First, the key topics discussed in the query are identified. Then, each context chunk is evaluated to determine whether the topics are present. This is then aggregated into a score between 0 and 100, with higher scores indicating that more of the topics present in the query are discussed in the context.
Answer Relevancy
Answer Relevancy evaluates the response, using the query and aims to determine whether the response includes an attempt to answer the question, while being free from superfluous information. The response is used to generate a question for which the response would be suitable. The actual and generated questions are then compared, resulting in a similarity score between 0 and 100. A higher score means the response is more likely to have answered the correct query.
Hallucination Classes
Hallucination Classes: Industry Agnostic Healthcare Claims Financial Services Life Sciences Medical Industry
Alignment Metrics Details
Tone
Tone evaluates the emotional content of text by determining which three emotions are most strongly present. The assessment uses a fine-tuned model to analyze the text against a broad spectrum of emotional examples. Each of the three detected emotions is scored between 0 and 100, where a higher score indicates a stronger presence of the corresponding emotion. This helps in understanding the emotional impact of the text.
Clarity
Clarity focuses on how easy the text is to read, considering its grammar and structure. The clarity of the text is quantified into a score from 0 to 100, with higher scores indicating that the text is easier to read. This metric is crucial for ensuring that the text is understandable without ambiguity, making it accessible to a broader audience.
Formality
Formality measures the level of formality in text. The text is segmented into sentences, each of which is encoded and analyzed by a fine-tuned, topic-classifier model that compares it to a wide range of texts varying in formality. Each sentence receives a score, contributing to an overall formality score between 0 and 100, with higher scores indicating a more formal tone. This metric is vital for ensuring text suitability in professional or casual contexts.
Helpfulness
Helpfulness evaluates the effectiveness of a response in addressing the query posed. It considers the relevance, detail, and usefulness of the information provided in the response. Both the query and the response are analyzed using a fine-tuned model that benchmarks them against examples of helpful and unhelpful responses. Scores range from 0 to 100, with higher scores indicating a more helpful response.
Simplicity
Simplicity assesses the ease of understanding the text. It analyzes the complexity of the vocabulary used by breaking the text into tokens and evaluating the rarity of each token within common literature. The overall simplicity score ranges from 0 to 100, where higher scores signify that the text uses simpler, more common words and phrases, making it easier to comprehend.
Toxicity
Toxicity determines the presence of harmful or offensive content within the text. Utilizing a collection of fine-tuned models, each trained to recognize different forms of toxicity, the text is scored on its overall toxicity and on specific five toxic styles. Scores range from 0 to 100 for each style, with higher scores indicating more pronounced toxicity. This metric is essential for moderating content.
Additional Information
For further assistance or to report issues with the Trustwise AI Portal, please contact our support team at support@trustwise.ai.