Command Center
Overview
The Command Center is where users can view the results of their completed scans and generate detailed reports. We will guide you through the different sections of the Command Center and the types of information you can access.
The Command Center allows you to:
- View the status of your completed scans.
- See detailed summaries for successful scans.
- Generate three types of comprehensive reports to gain deeper insights into the scan results.
- Download these reports as PDF documents.
Command Center Home
The Command Center Home page displays a list of your previous scans, including important details like the scan status, blueprint name, and scan creation date. If all iterations in a scan were successful, the status indicator will be green, and you'll be able to view a summary of the scan and generate reports.
Clicking on a successful scan reveals a summary and report generation options.
Scans
- Actions and Status: The "Actions" column allows users to interact with the scan, while the "Status" indicator (green for successful scans) shows whether all iterations were completed successfully.
- Blueprint Name, User, and Scan Details: The summary table also displays the associated blueprint name, the user's name, and the scan creation date.
Scan Status Indicators
- Blue: The scan is created and queued.
- Yellow: The scan is in progress.
- Green: The scan completed successfully.
- Red: The scan failed. The importance of the Failed Scan status is that it enables the support team to quickly identify and address problems.
Scan Summary
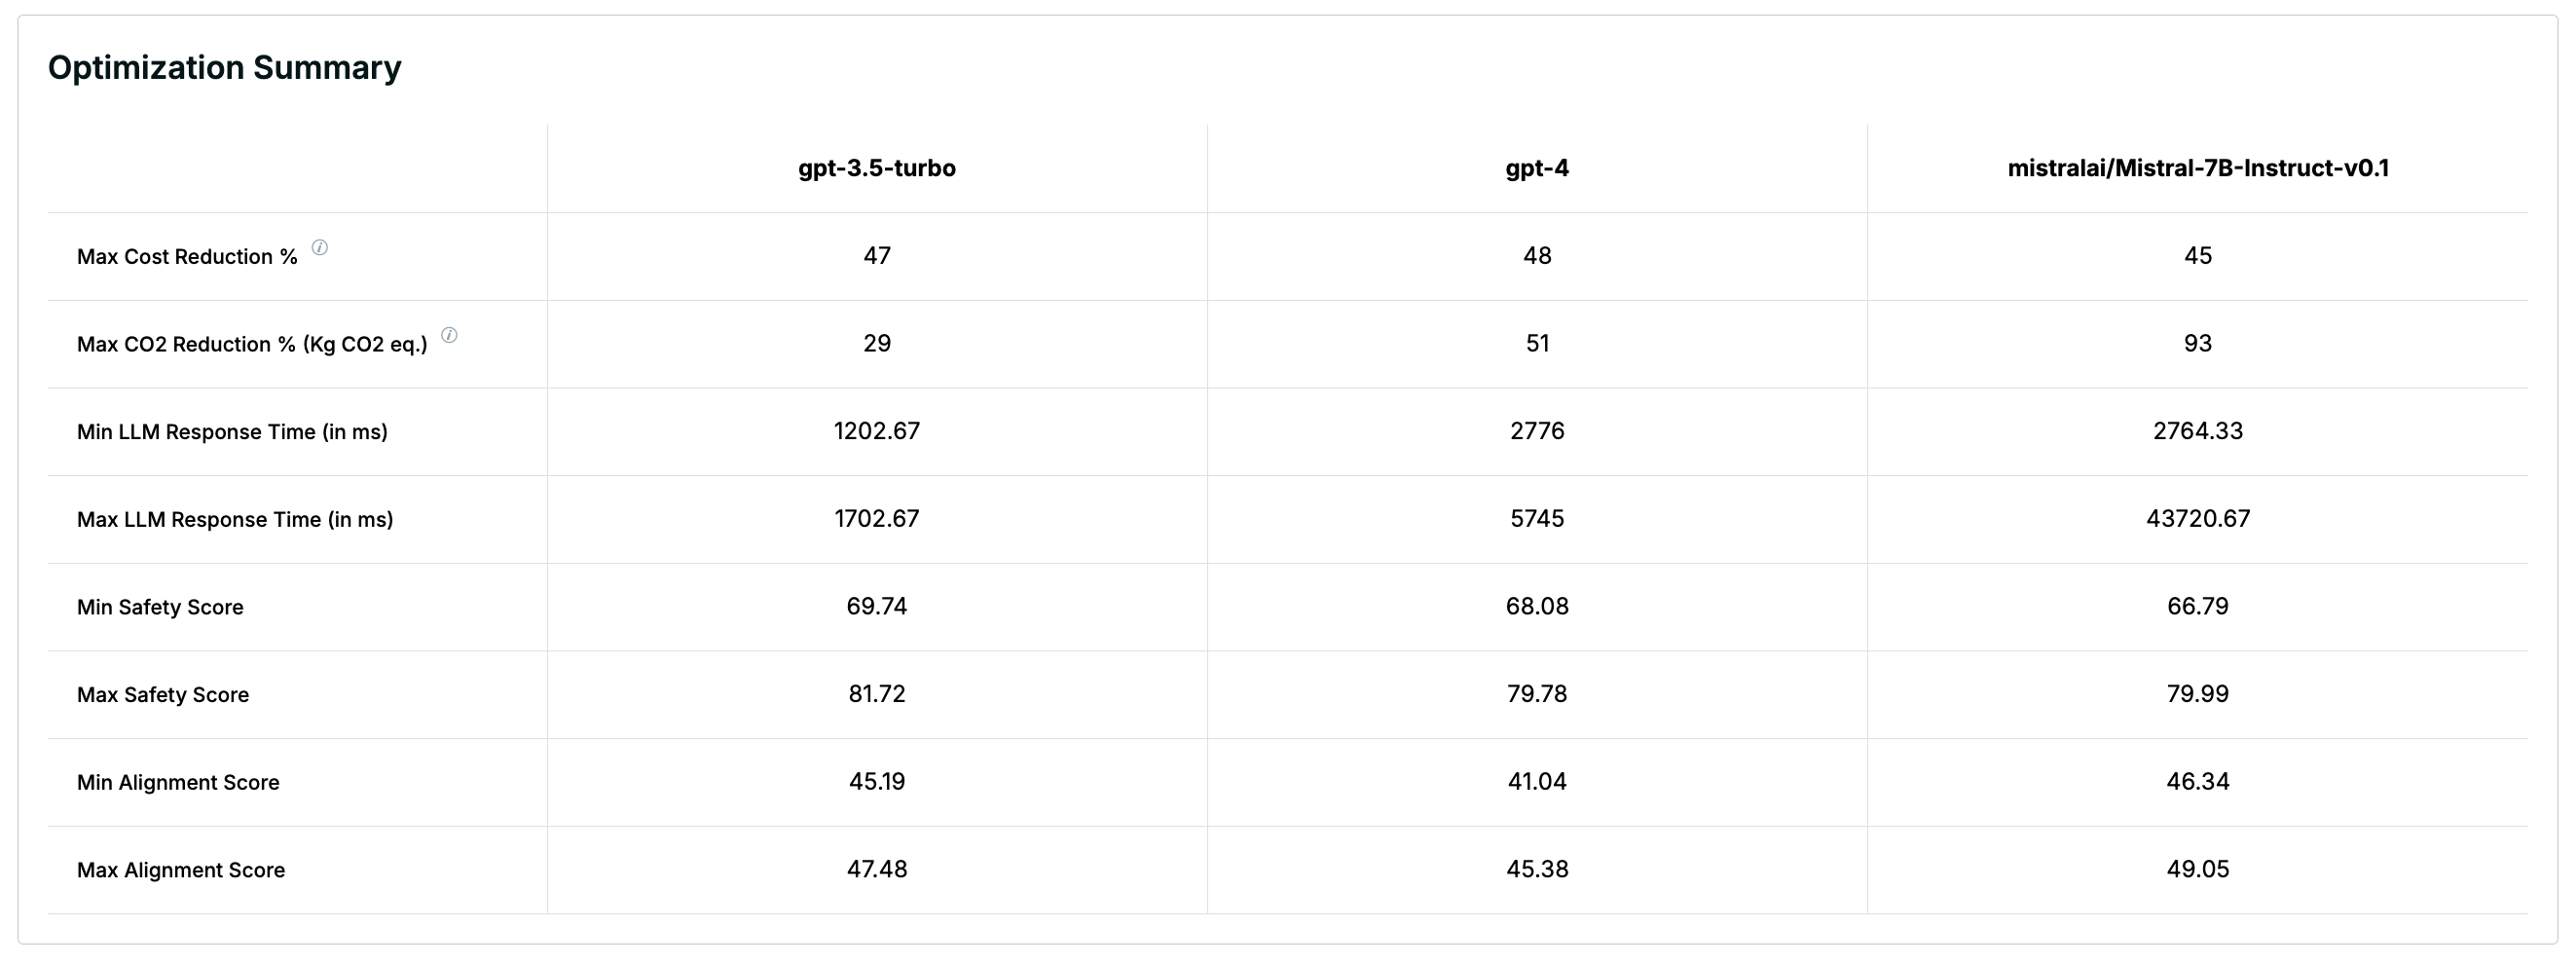
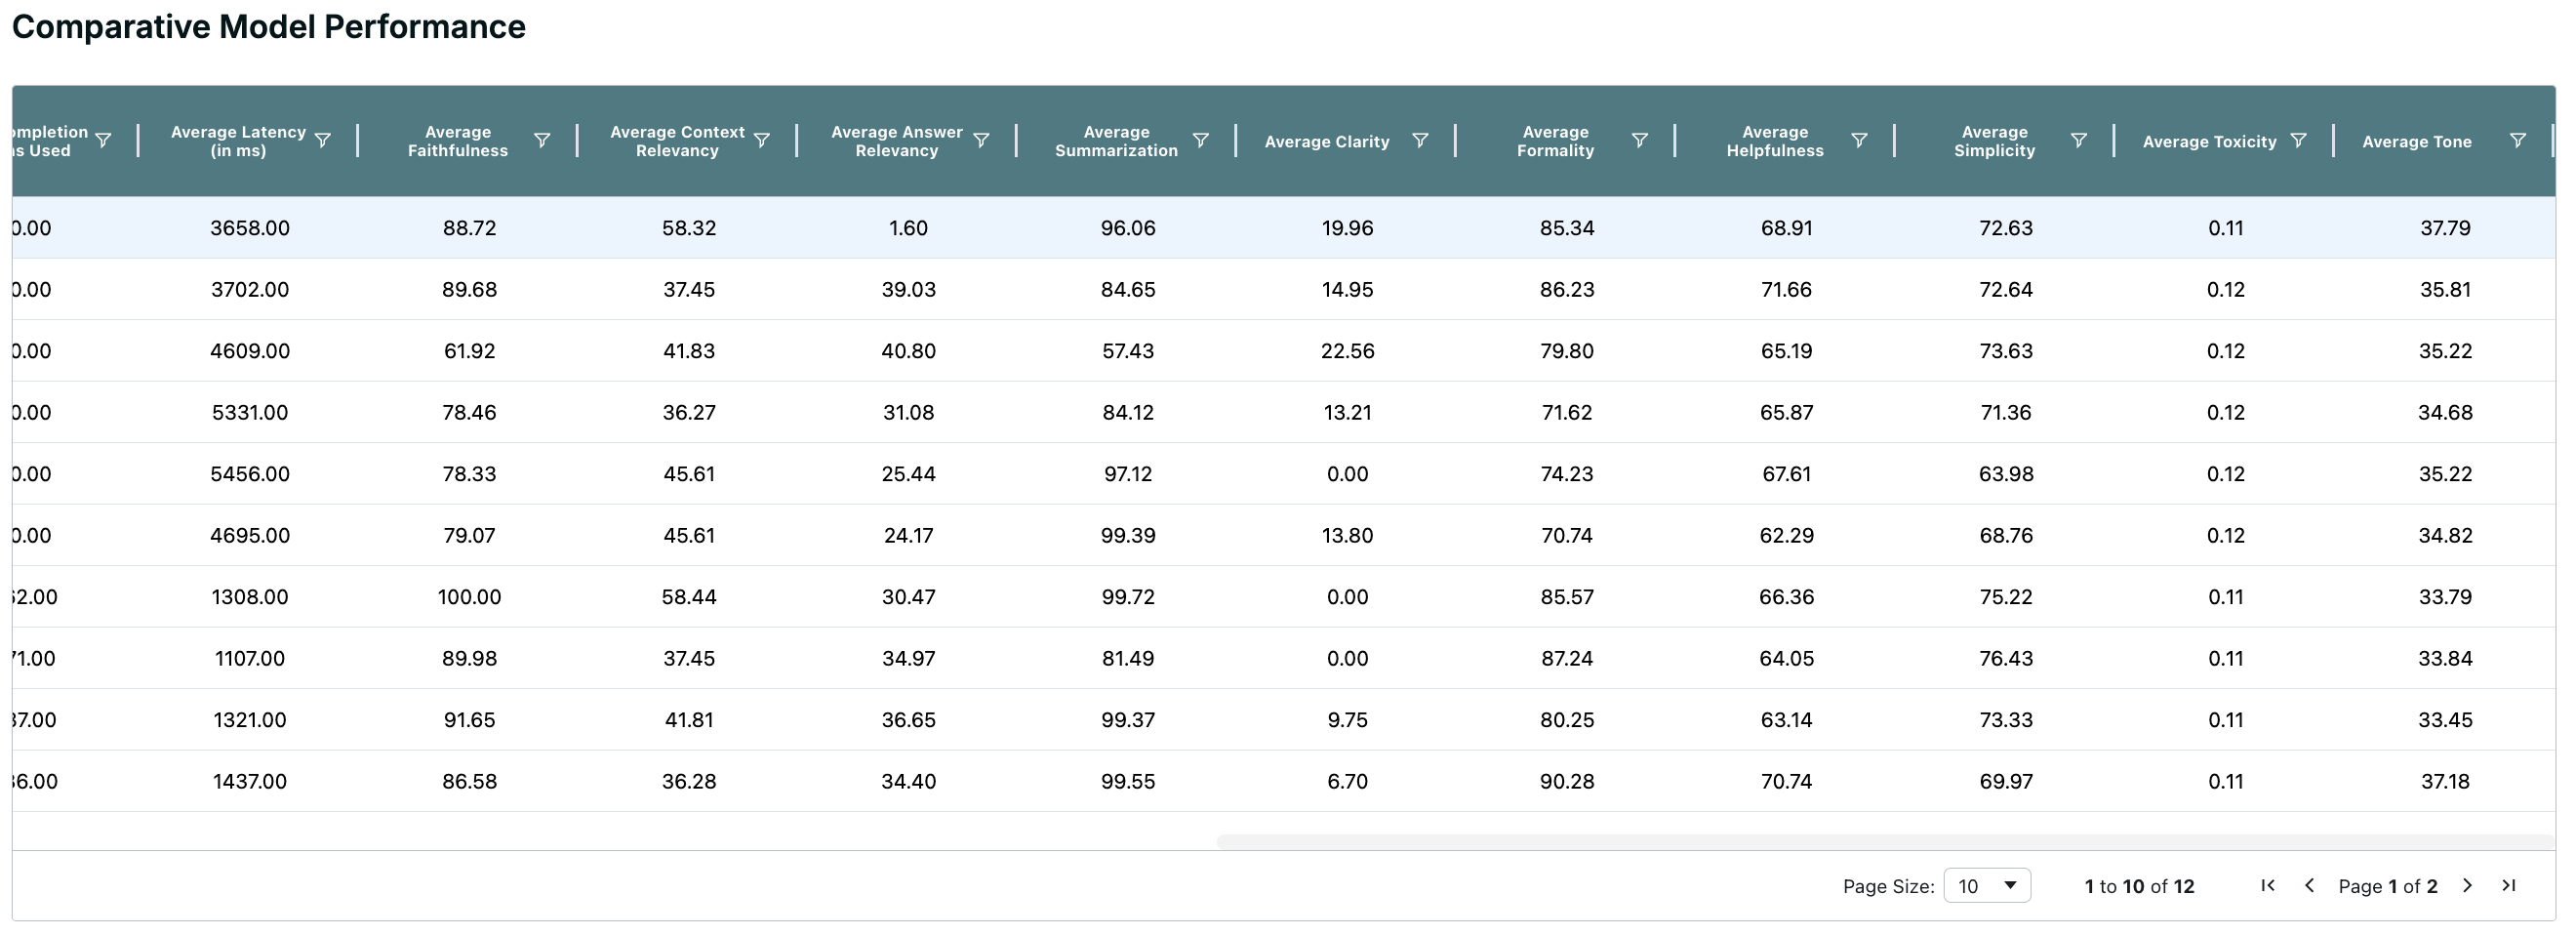
For successful scans, users can view the Optimization Summary, which includes metrics like cost reduction, carbon footprint reduction, LLM response times, and various safety and alignment scores for each language model used in the scan. Additionally, users can explore visualizations such as the Financial Cost Scatter Plot, Radar Chart, and the Comparative Model Performance Leaderboard to better understand model performance.
Optimization Summary Metrics:
- Max Cost Reduction %: Shows the maximum cost savings that could be achieved.
- Max CO2 Reduction %: Indicates the maximum potential reduction in carbon emissions.
- Min and Max LLM Response Time (in ms): Shows the minimum and maximum response times for each model.
- Min and Max Safety Scores: Displays the range of safety scores for the models tested.
- Min and Max Alignment Scores: Shows how well the responses align with set standards.
Financial Cost Scatter Plot:
- This plot shows the estimated financial cost for different model iterations in relation to their composite performance scores, helping users assess cost efficiency at a glance.

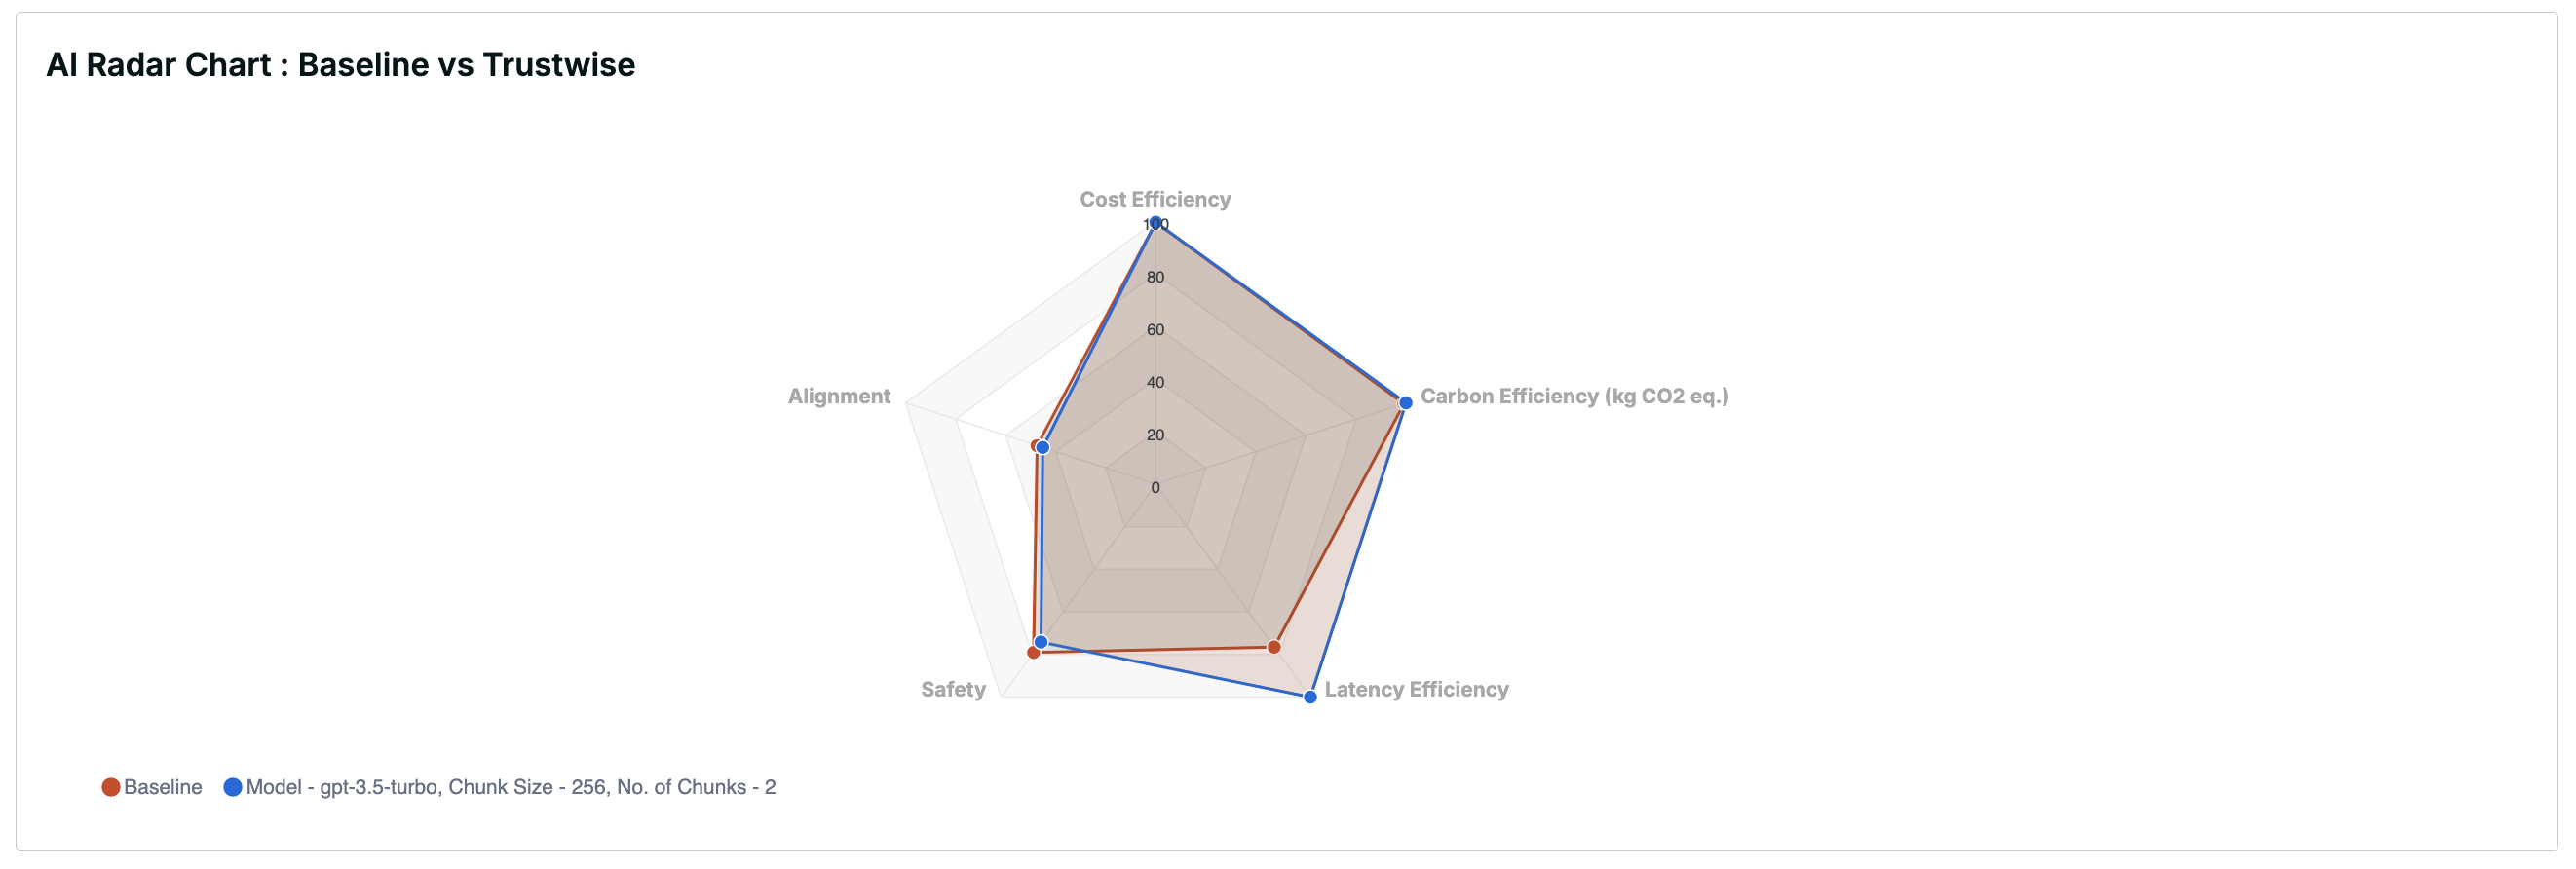
Radar Chart:
- The radar chart compares baseline model performance with Trustwise's optimized version, highlighting dimensions like cost efficiency, carbon efficiency, latency, alignment, and safety.
Comparative Model Performance Leaderboard:
- A leaderboard that provides a detailed comparison of each model iteration, including metrics like cost estimate, latency, carbon emissions, and token usage.
Reports
For successful scans, users have the ability to generate three types of reports: the Model Card Report (LOD 1), Risk and Compliance Report (LOD 2), and Audit and Finance Report (LOD 3). These reports can either be viewed on the Command Center page or downloaded as PDF files for further analysis.
Below is a summary of each report and the key categories included.
1. Model Card Report (LOD 1)
The Model Card Report provides an overview of the AI models used, including details on model performance, cost, and various metrics evaluated during the scan.
Key Categories in the Model Card Report:
- IT and Business Summary: Includes Safety Score, Cost, and Alignment Score ranges for each model.
- Model Details: Description of each model, including architecture and licensing information.
- Safe:ai Module Metrics: Evaluation of the model's faithfulness, relevancy, summarization, and toxicity scores.
- Fast:ai Module Metrics: Performance metrics such as throughput and response time.
- Green:ai Cost and Carbon Metrics: Cost and carbon emission estimates for the models.
2. Risk and Compliance Report (LOD 2)
The Risk and Compliance Report assesses the operational risks and compliance performance of each model during the scan.
Key Categories in the Risk and Compliance Report:
- Fast:ai Module Metrics: Includes throughput and time per token.
- Green:ai Module Cost Metrics: Token usage costs for 10,000 prompts, including prompt and response token costs.
- Compliance Metrics: Provides operational details to verify compliance with internal and external standards.
3. Audit and Finance Report (LOD 3)
The Audit and Finance Report provides a financial assessment, including the cost-efficiency and environmental impact of each model.
Key Categories in the Audit and Finance Report:
- Green:ai Module Cost Metrics: Details on overall token usage costs, cost savings from AI optimization, and inference costs per token.
- Green:ai Module Carbon Metrics: Overview of CO2 emissions per prompt, total emissions, and cost efficiency.
Report Generation and Downloads
Users can generate any of the three reports mentioned above by selecting the appropriate report tab for each Line of Defense (LOD). Each report is available for download as a PDF for sharing or offline analysis.
For a successful scan, simply select the report type, and click on the Download Report button in top right corner to save the PDF version of the report. Each report provides different perspectives for users depending on their needs: technical performance, compliance assessment, or financial audit.
Additional Notes
For further assistance in understanding any specific metric or visualization, hover over the information icons provided next to each metric for an in-depth explanation.
For more questions or assistance, please refer to our user guide or contact our support team at help@trustwise.ai.